Data-Driven Decisions for Where to Park in SF
August 16, 2019
Have you ever felt uncertain parking in a shady area? In particular, have you ever parked in San Francisco and wondered, if I measured the average inverse square distance to every vehicle incident recorded by the SFPD in the last year, at what percentile would my current location fall?
If so, we built an app for that. In this post we’ll explain our methodology and its implementation.
Parking in San Francisco
Vehicle-related break-ins and thefts are notoriously common in San Francisco. Just last week, items worth half a million dollars were stolen in a high-profile car burglary. There’s even a Twitter account tracking incidents.
The San Francisco Police Department maintains an ongoing dataset of all incidents since January 1, 2018 (there is another one for 2003-2018). The San Francisco Chronicle has created a great map visualization from this to track break-ins. We wanted to make this data even more actionable, to help asses the security of parking in a particular location in real-time.
Hence, the motivating question: if I am looking to park in SF, how can I get a sense of how safe my current spot is?
Defining a Risk Score
Of course, the risk of a parking spot can be measured in many different qualitative and quantitative ways. We chose a quantitative measure, admittedly quite arbitrary, as the average inverse square of the distance between the parking location and every break-in location in the past year.

This just gives a numerical score. We then evaluate this score across a representative sample of parking spots across SF, and place the current parking spot at a percentile within that sample. The higher the score, the closer the spot is to historical incidents (inverse of distance), the higher the risk.
We decided to build a mobile app for showing how secure your parking spot is.
Now, we just have to use the data to compute the risk score percentile. For this task, we’ll load the SFPD data into a Rockset collection and query it upon a user clicking the button.
Loading the Data
To get started quickly, we’ll simply download the data as a CSV and upload the file into a new collection.
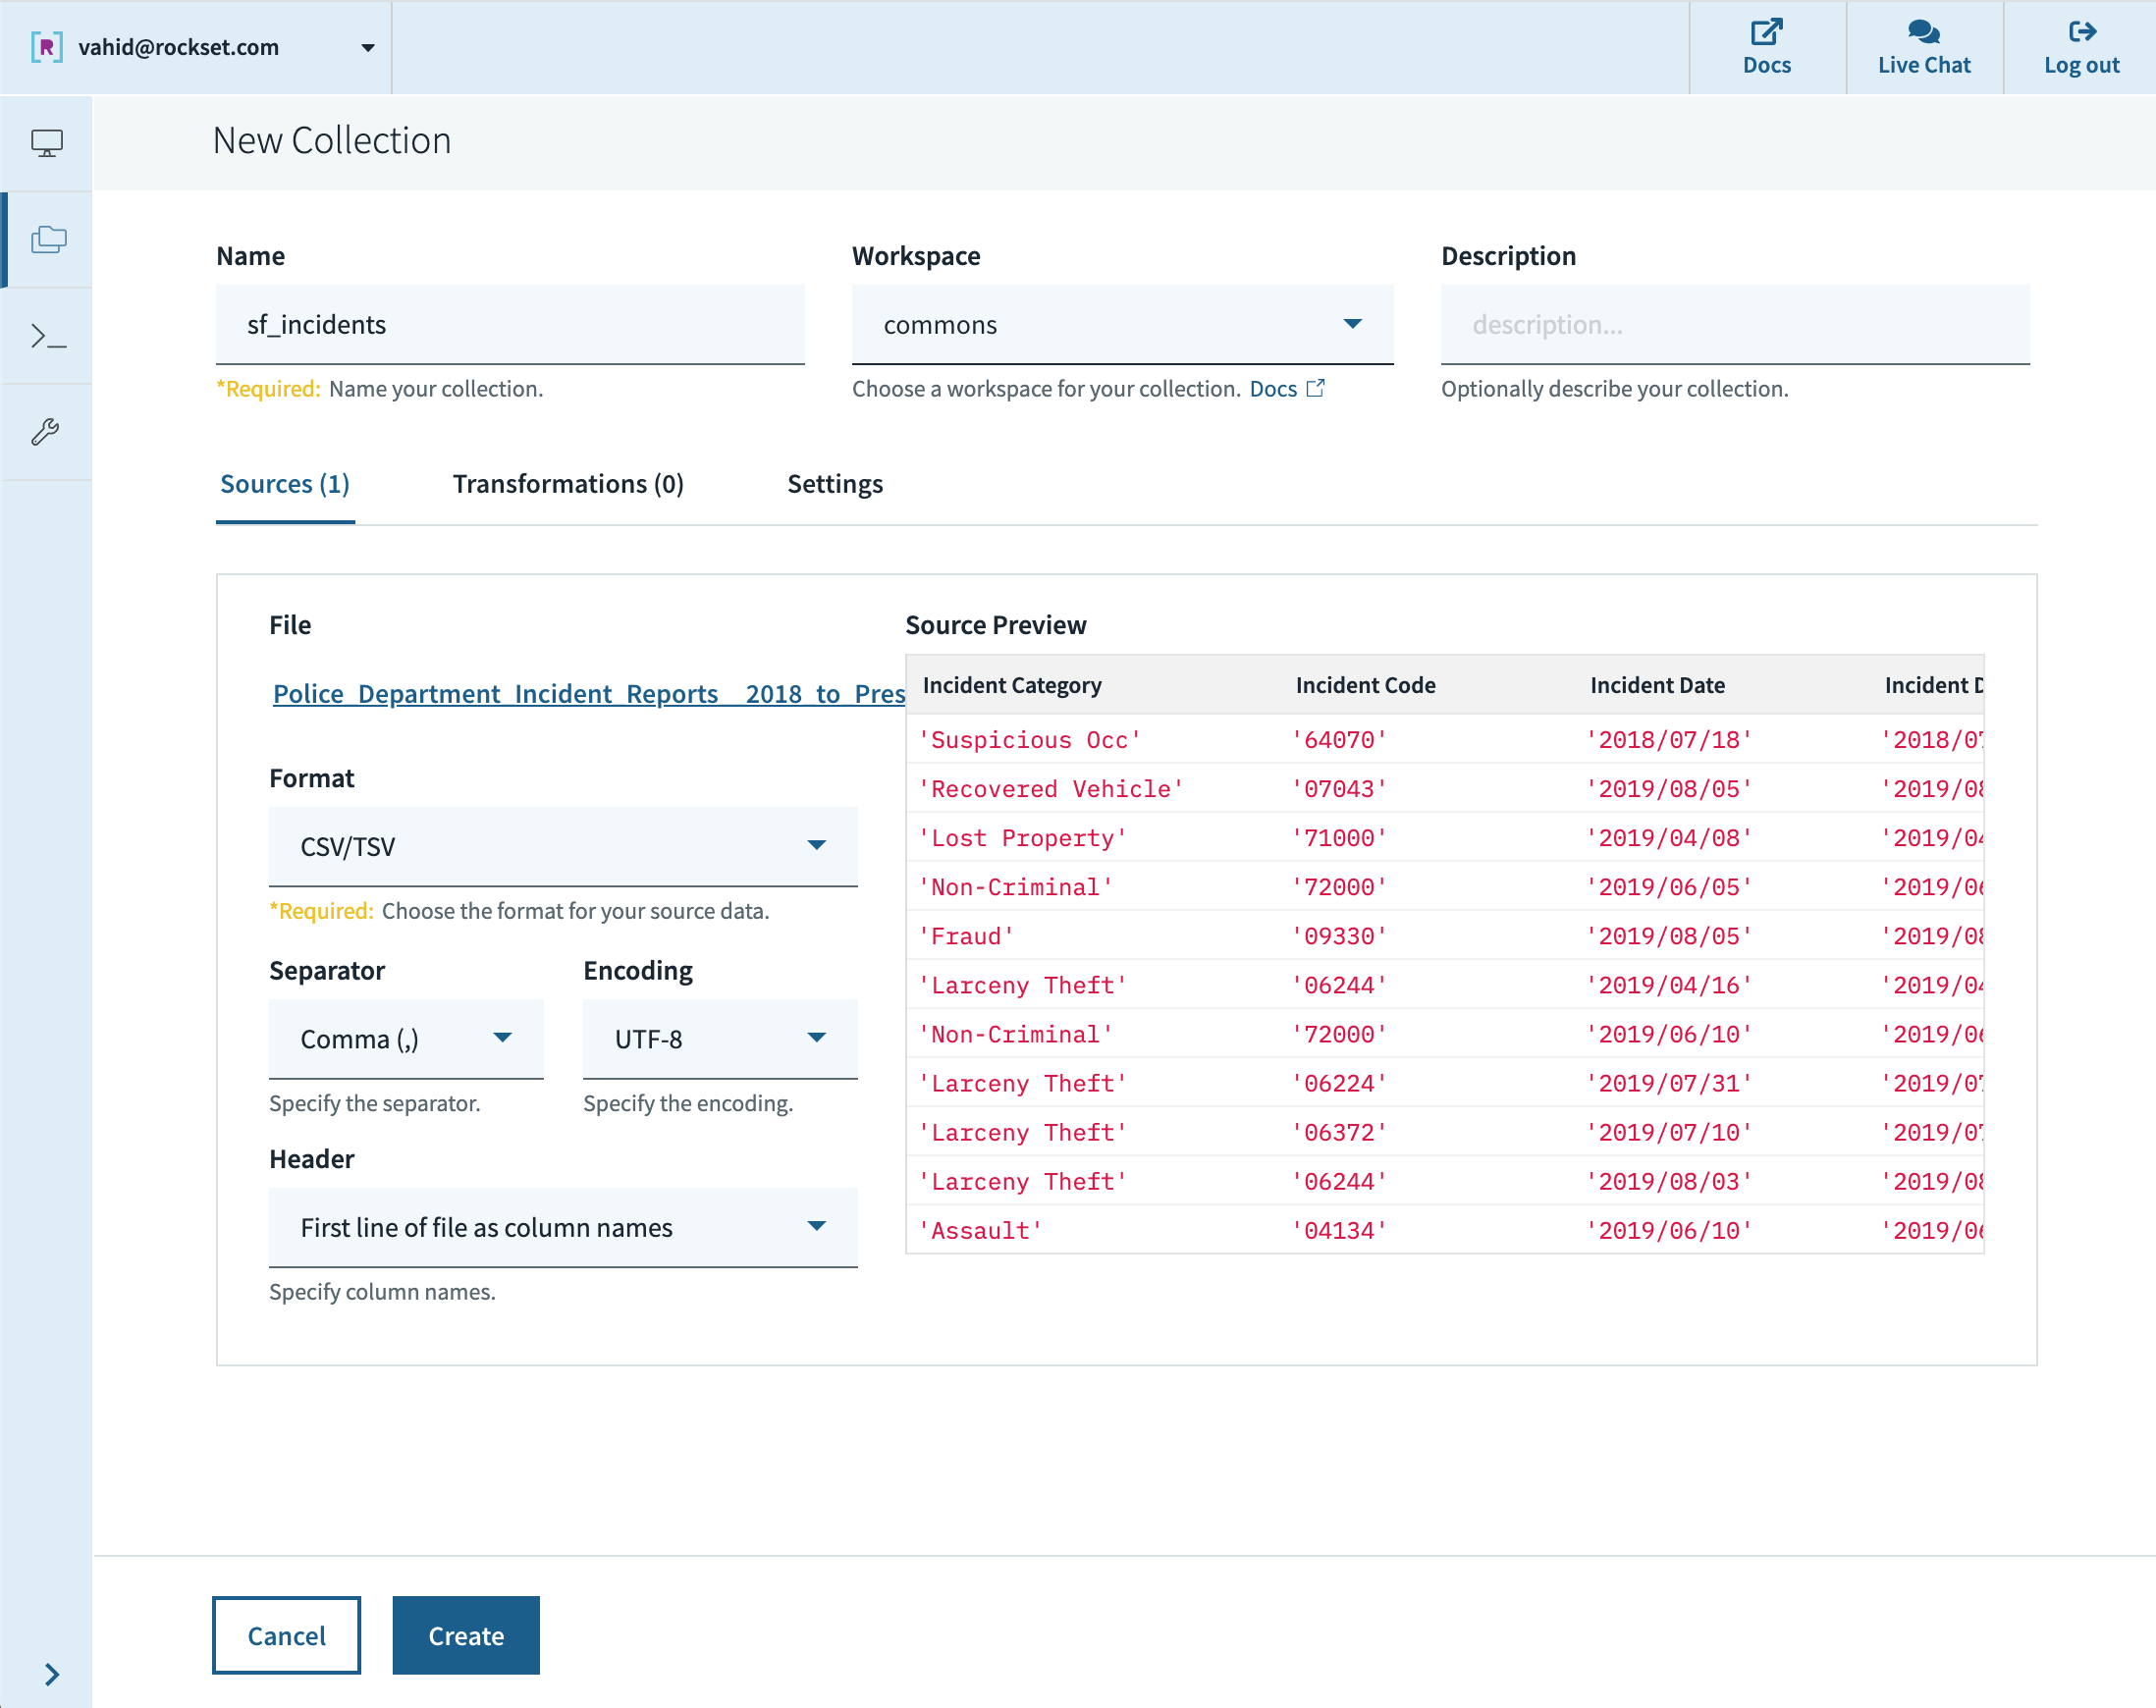
Later, we can set up a periodic job to forward the dataset into the collection via the API, so that it always stays up to date.
Filtering the Data
Let’s switch over to the query tab and try writing a query to filter down to the incidents we care about. There are a few conditions we want to check:
-
Vehicle-related incidents. Each incident has an “Incident Subcategory” assigned by the Crime Analysis Unit of the Police Department. We do a
SELECT DISTINCTquery on this field and scan the results to pick out the ones we consider vehicle-related.- Motor Vehicle Theft
- Motor Vehicle Theft (Attempted)
- Theft From Vehicle
- Larceny - Auto Parts
- Larceny - From Vehicle
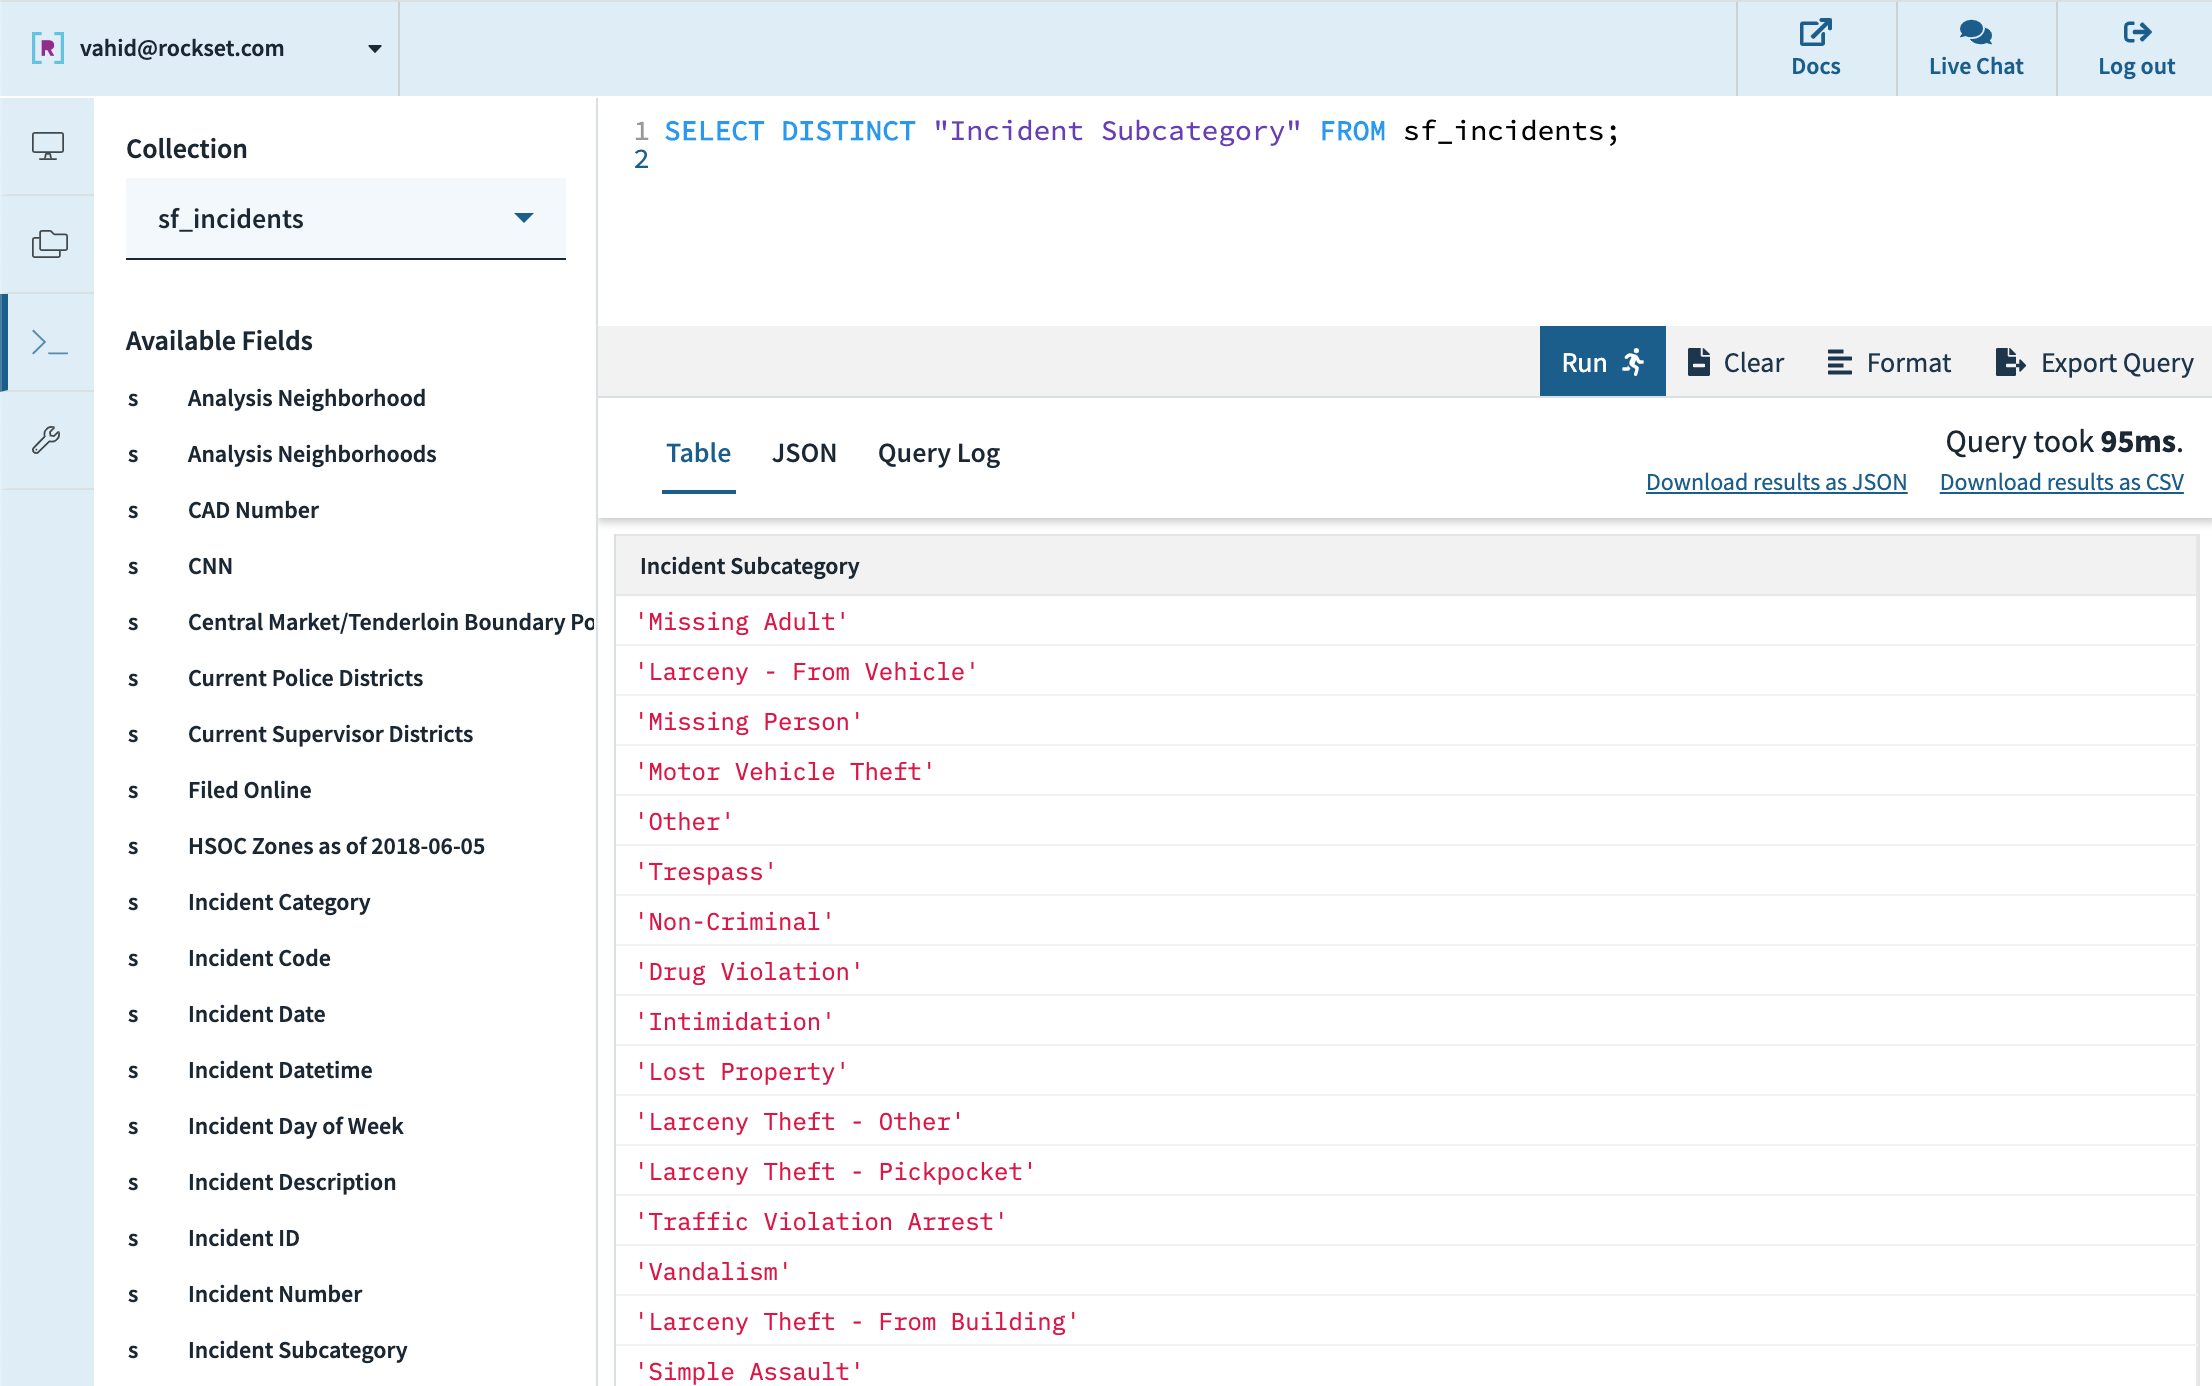
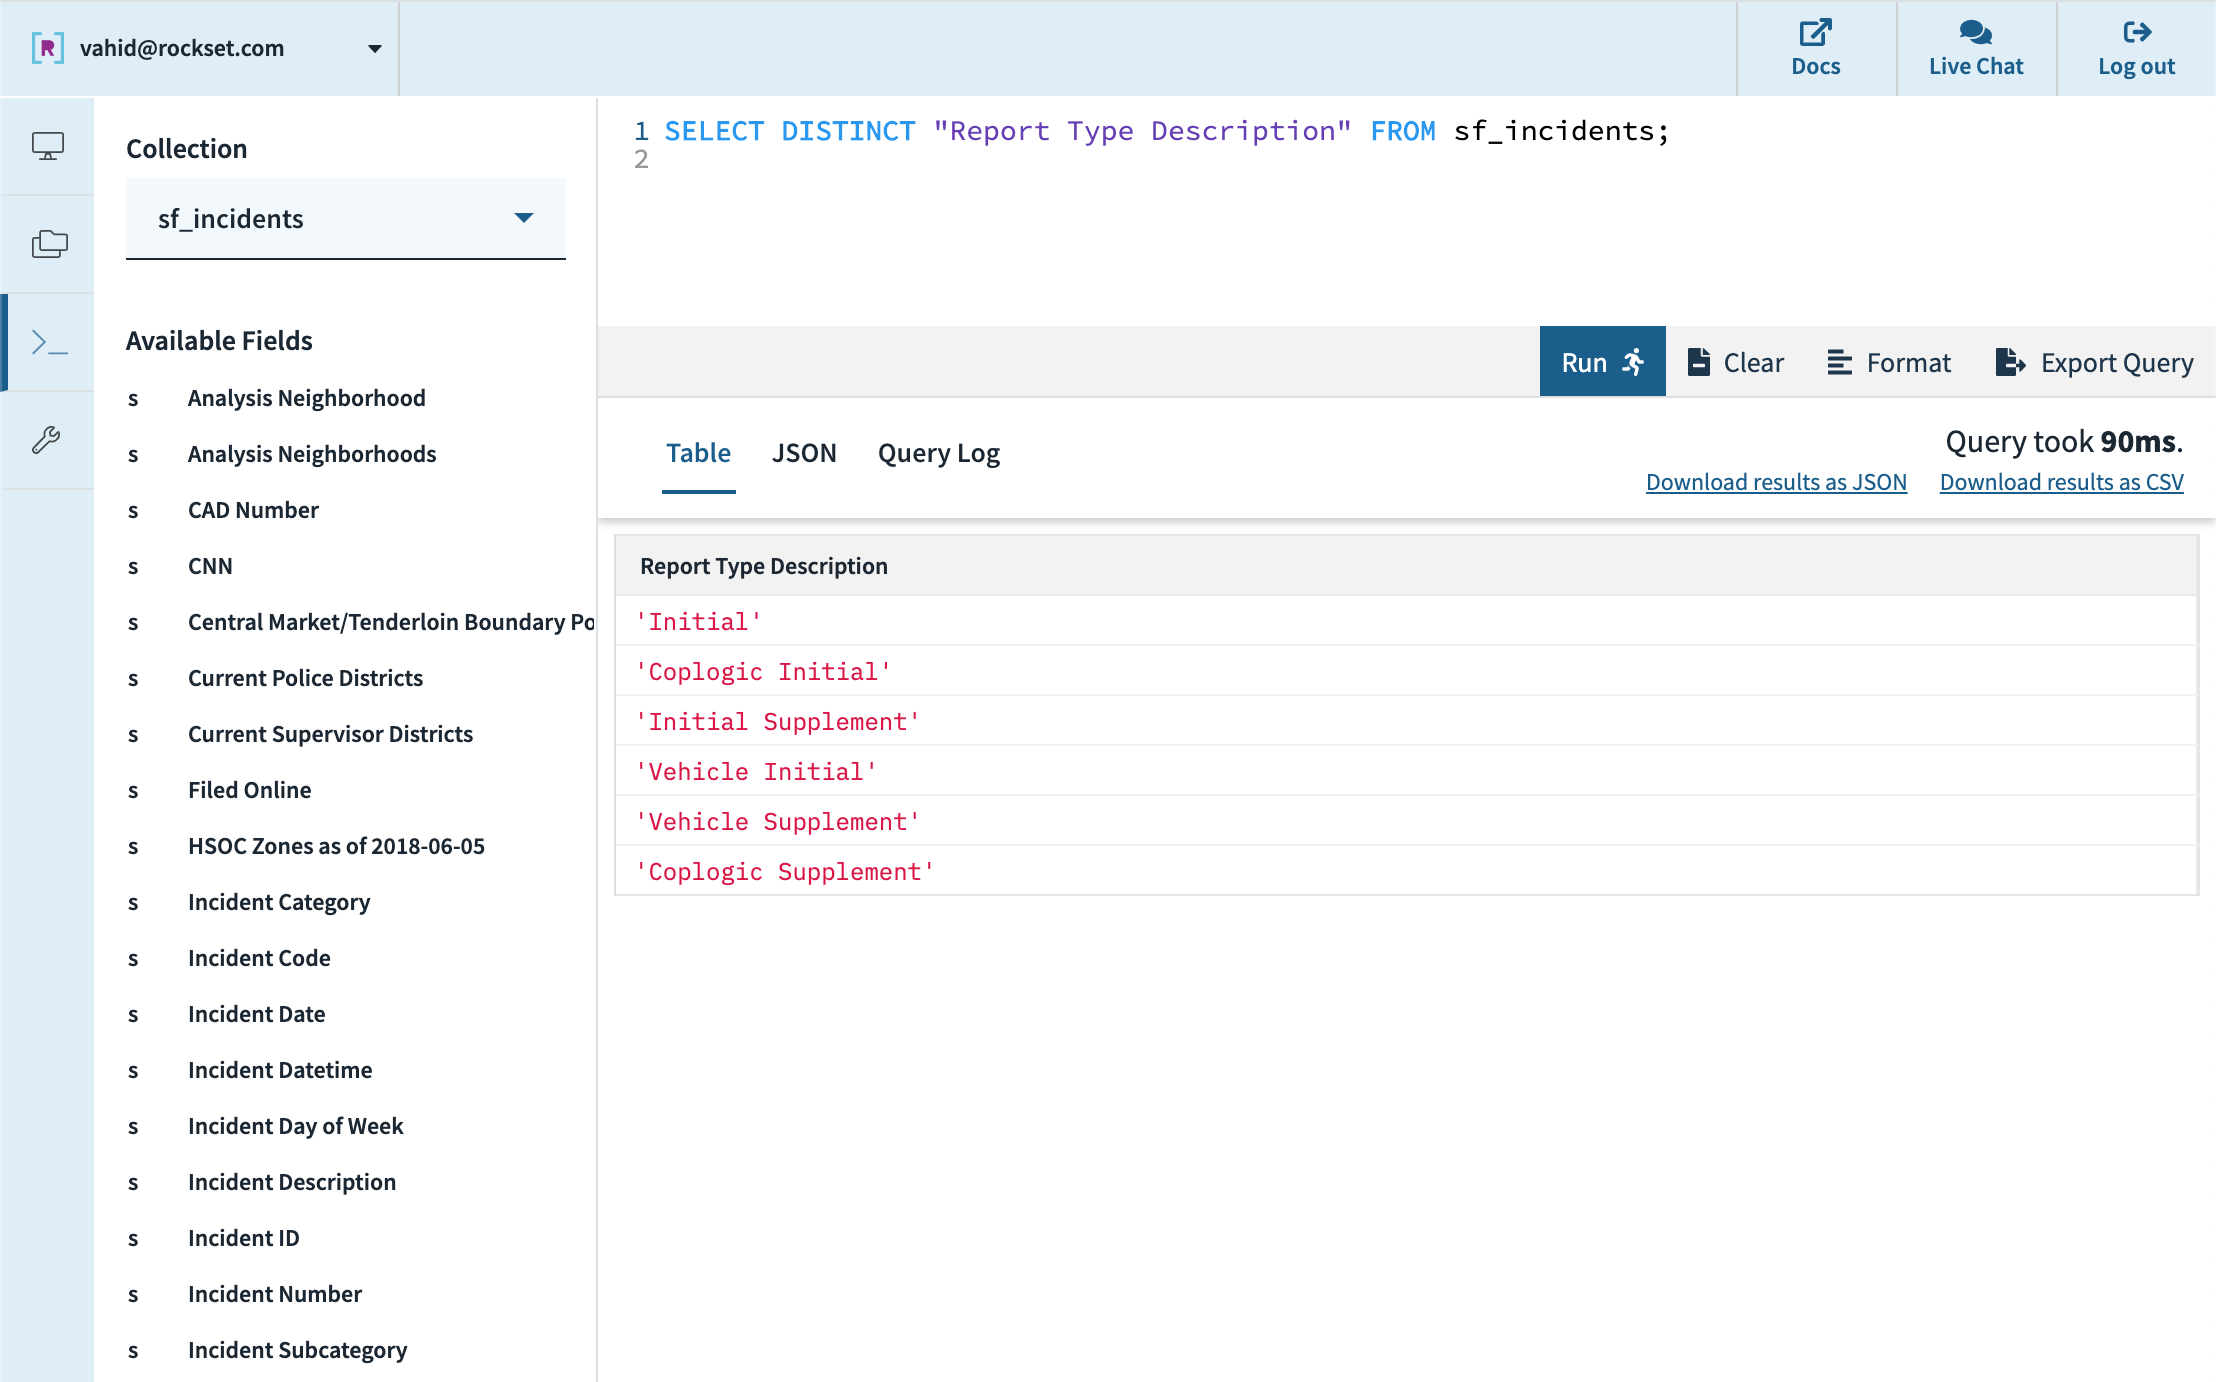
- Initial report. According to the data documentation, records cannot be edited once they are filed, so some records are filed as “supplemental” to an existing incident. We can filter those out by looking for the word “Initial” in the report type description.
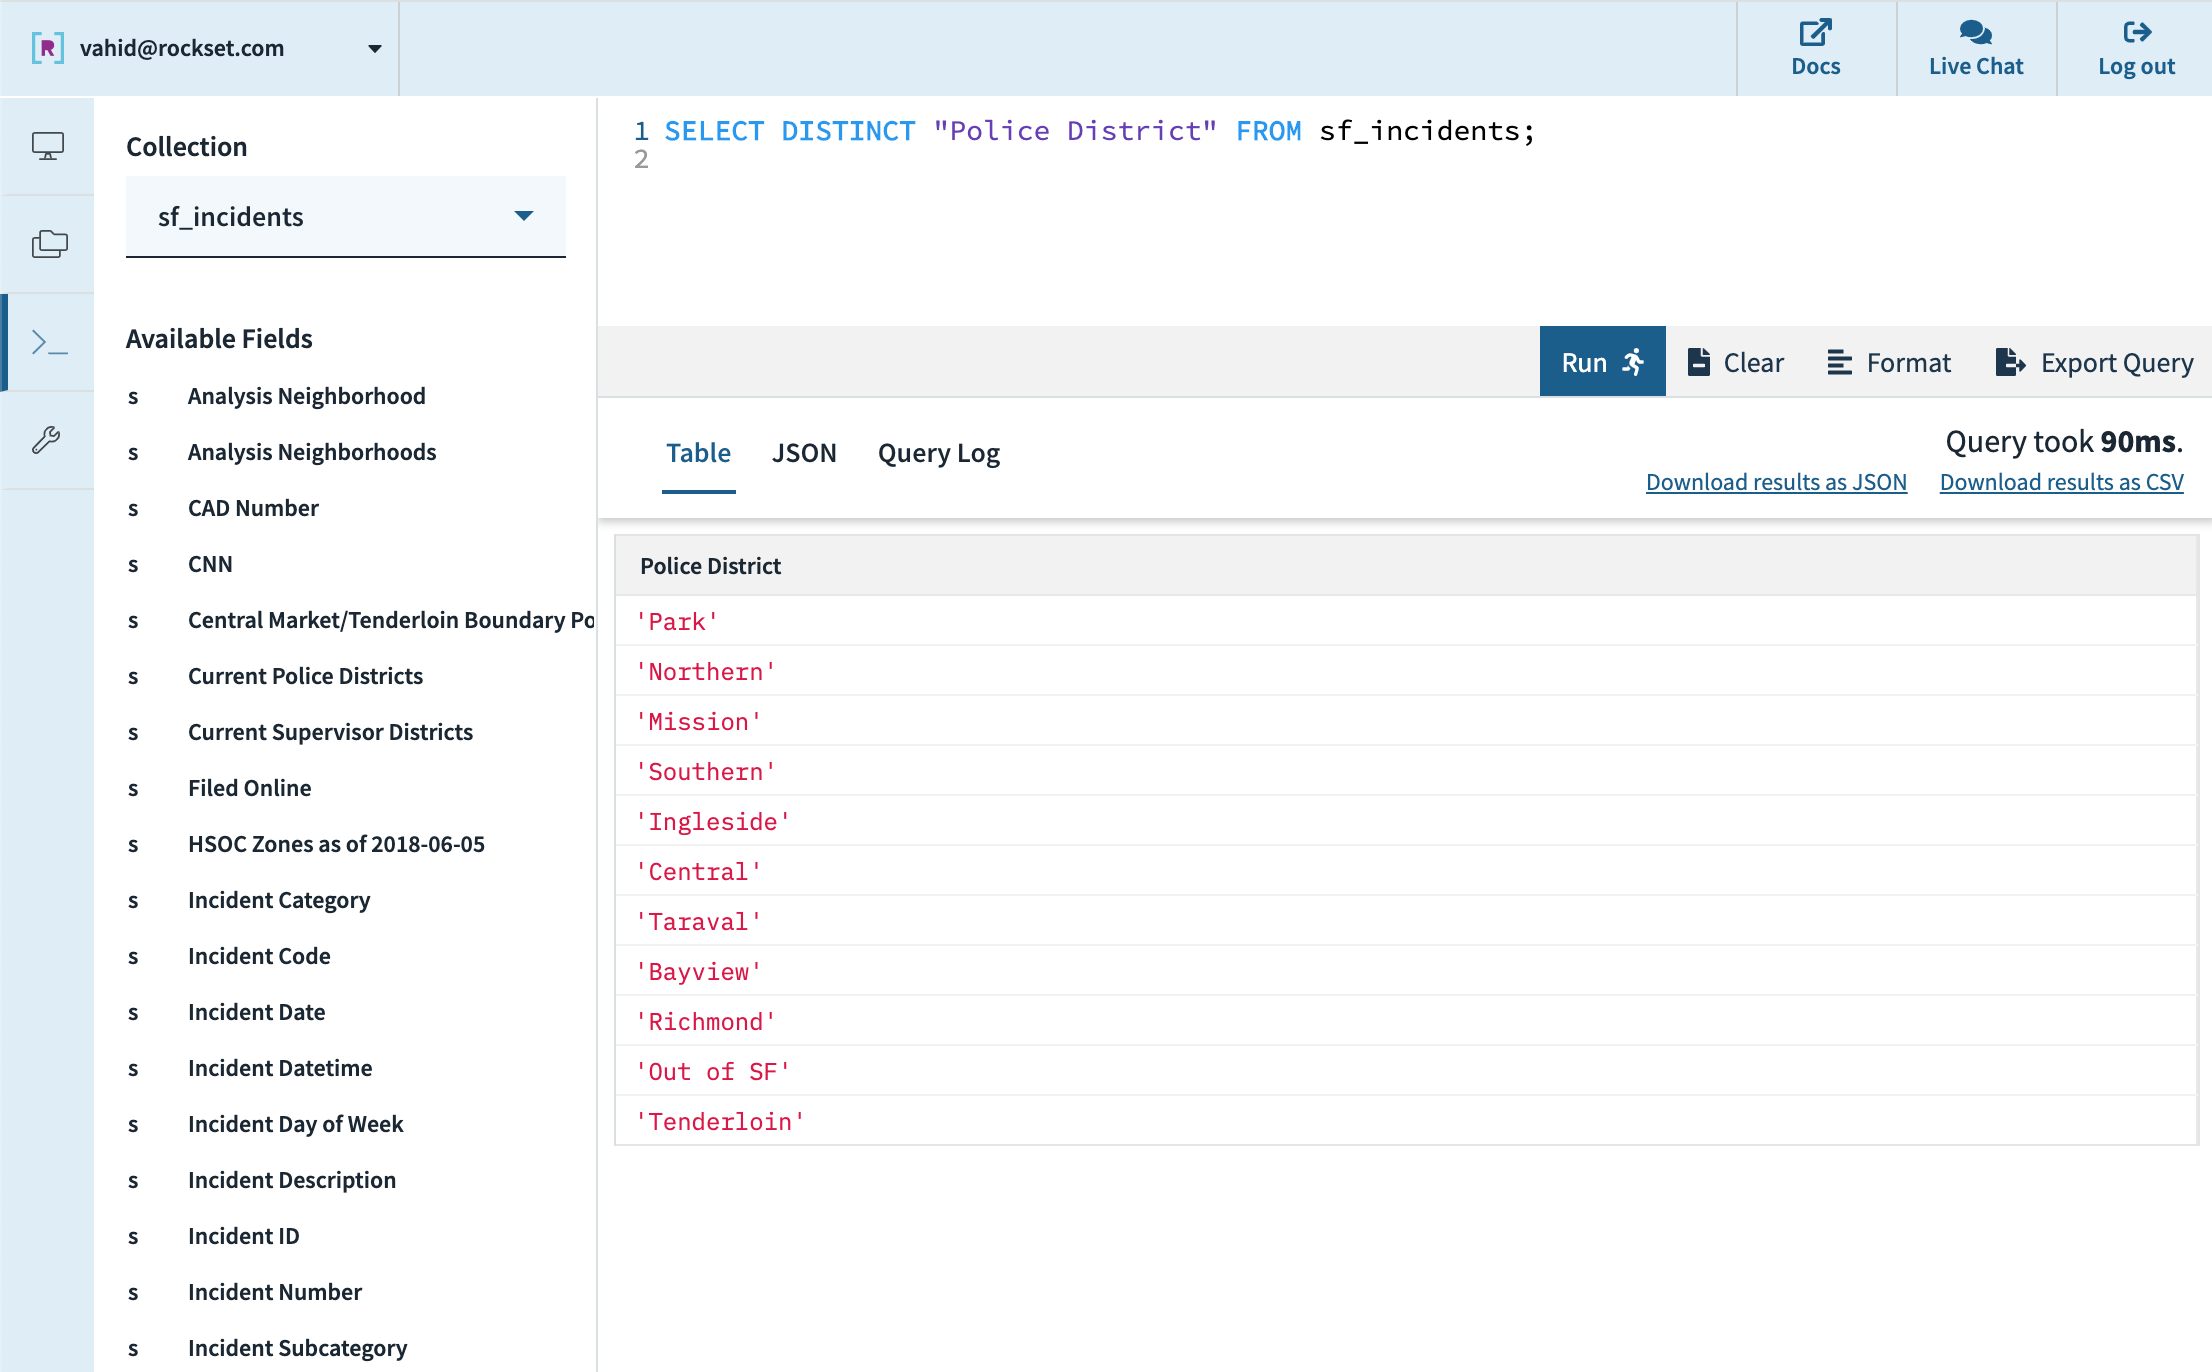
- Within SF. The documentation also specifies that some incidents occur outside SF, and that such incidents will have the value “Out of SF” in the police district field.
- Last year. The dataset provides a datetime field, which we can parse and ensure is within the last 12 months.
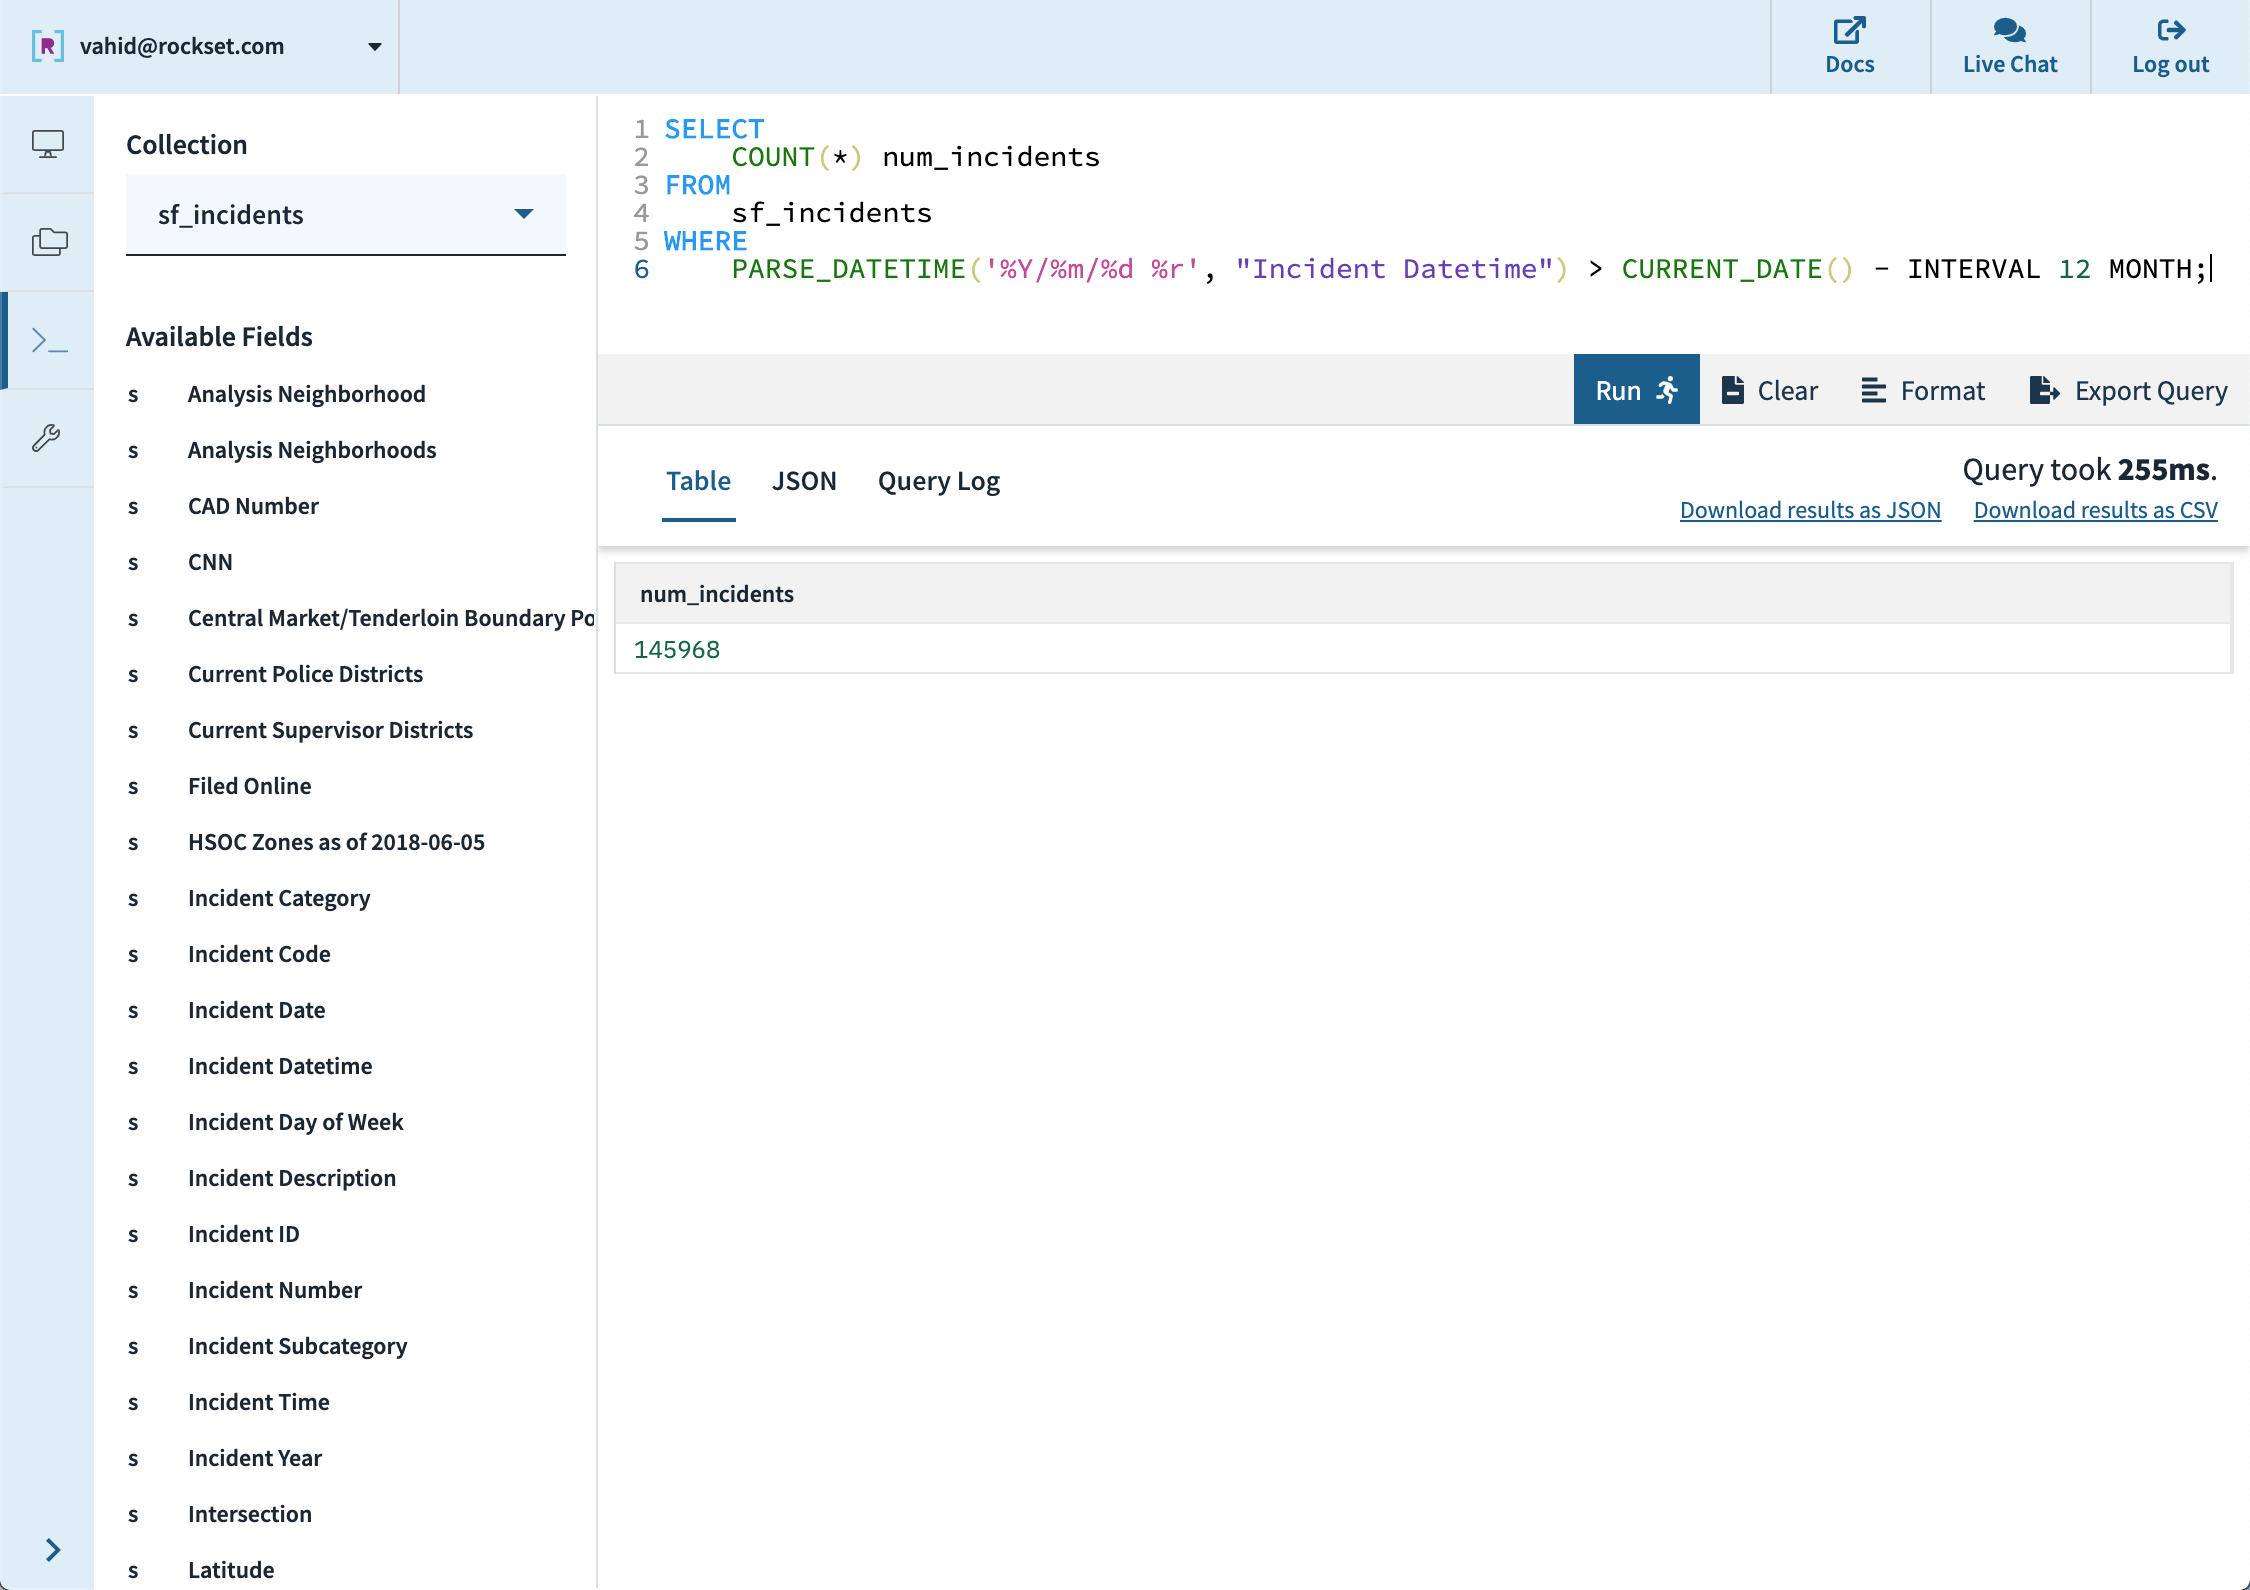
- Geolocation available. We notice some rows are missing the latitude and longitude fields, instead having an empty string. We will simply ignore these records by filtering them out.
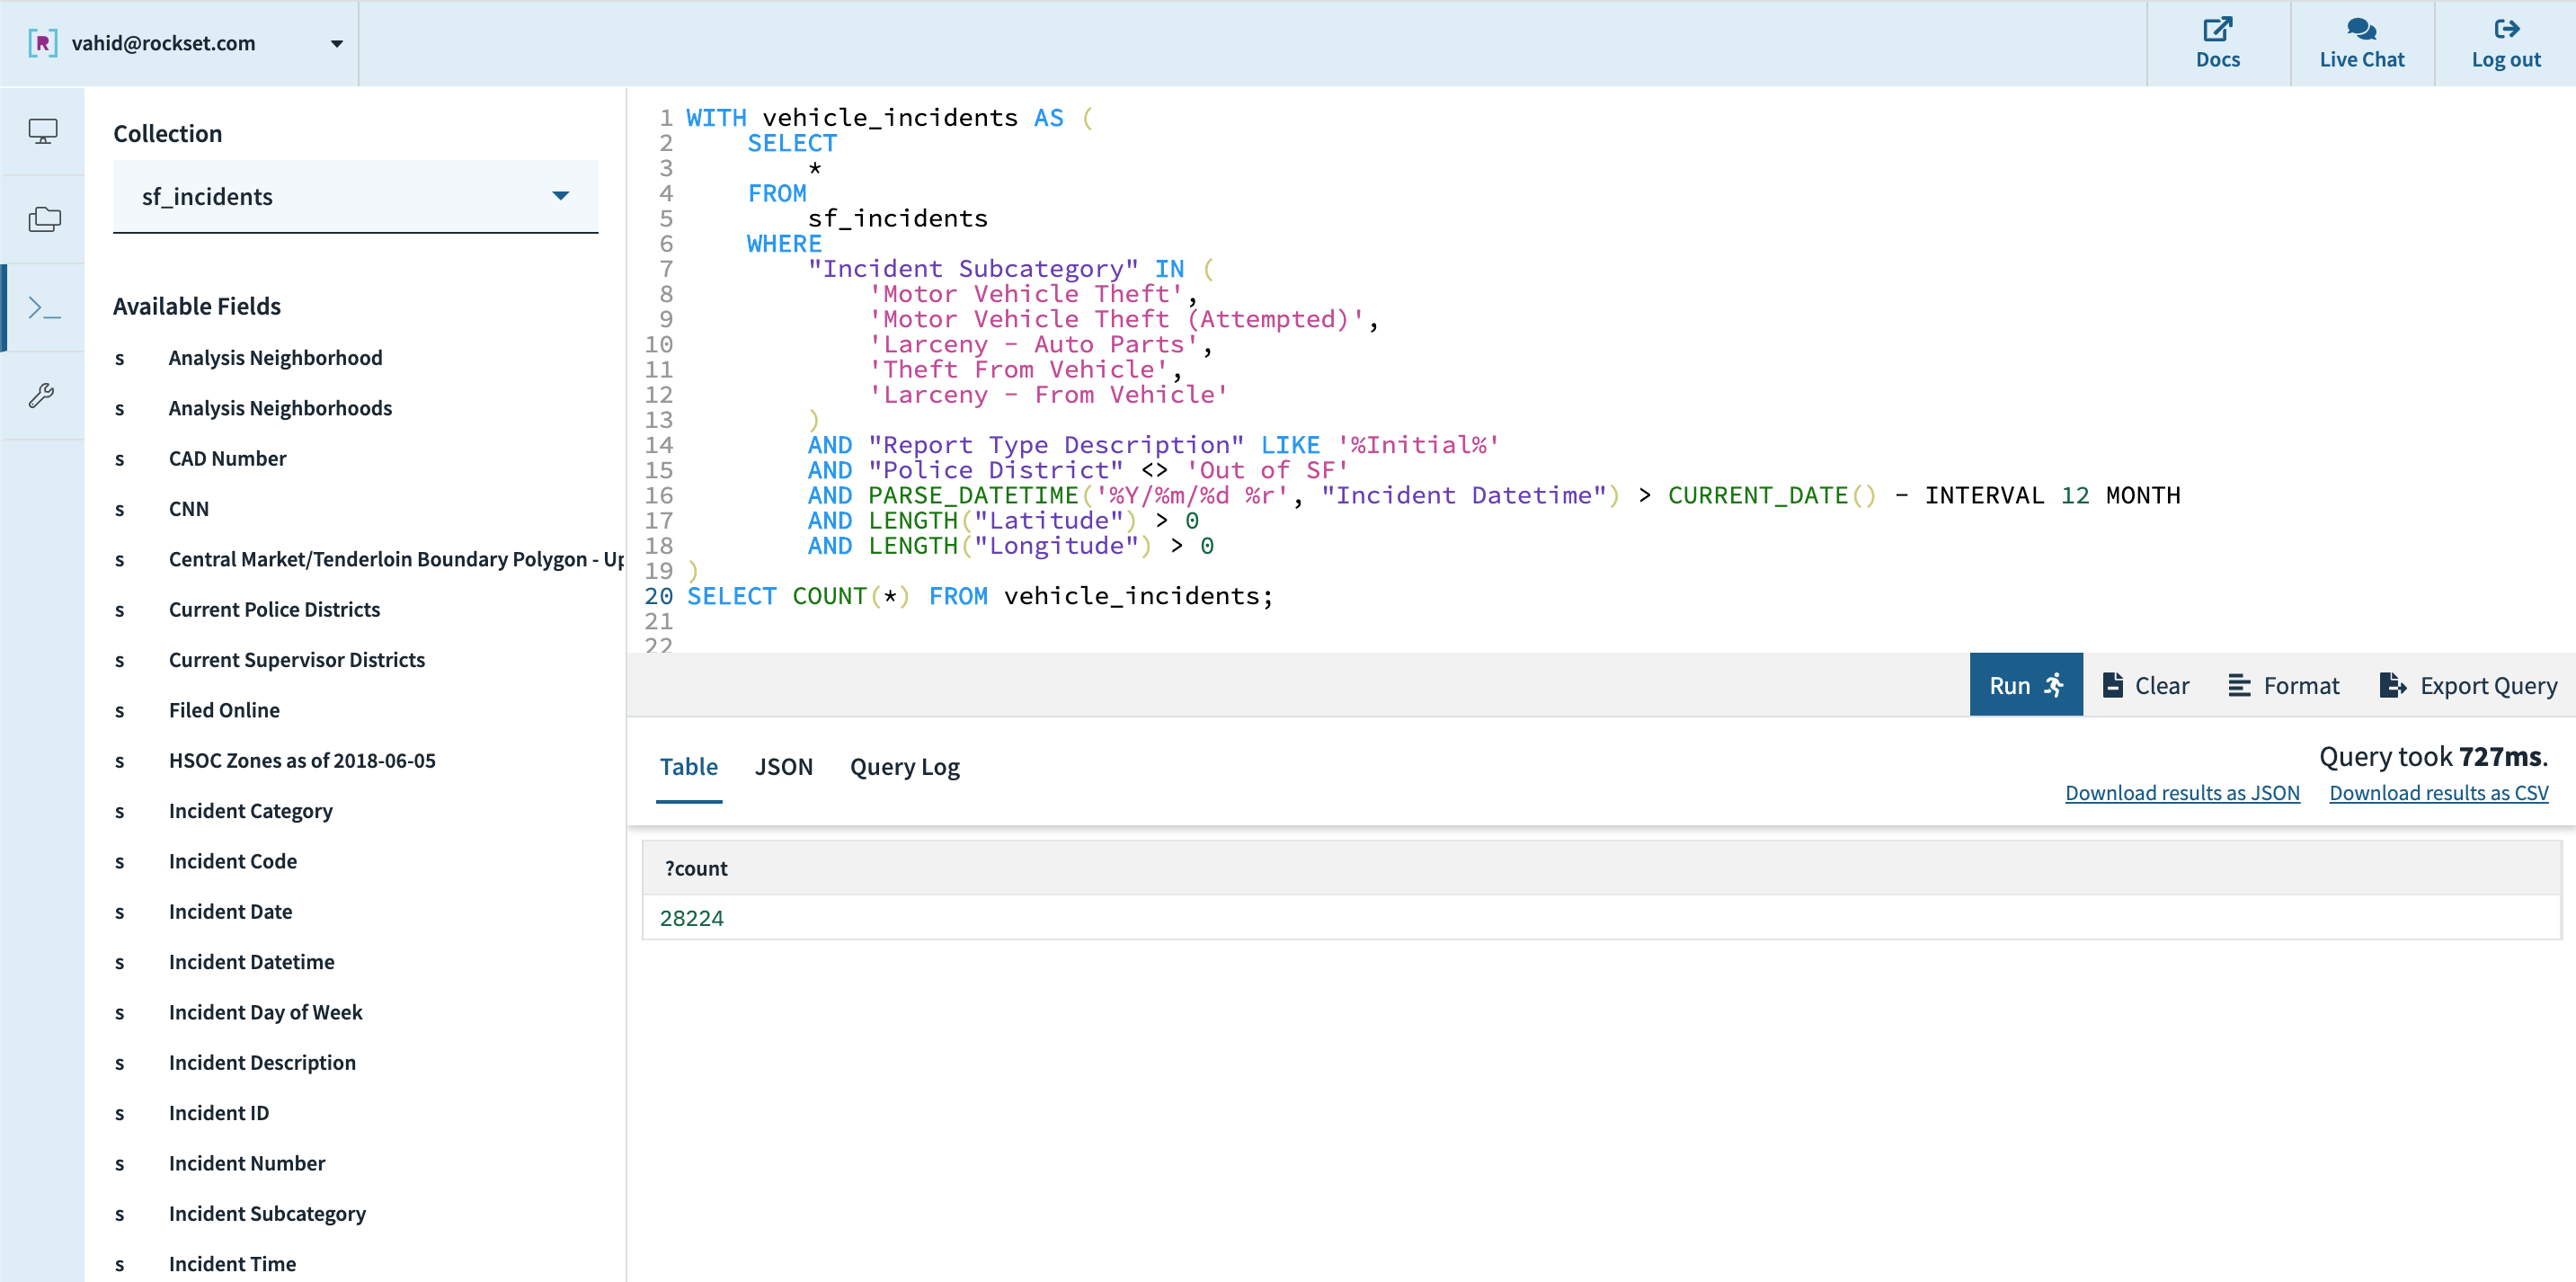
Putting all these conditions together, we can prune down from 242,012 records in this dataset to just the 28,224 relevant vehicle incidents, packaged up into a WITH query.
Calculating a Risk Score, One Spot
Now that we have all vehicle incidents in the last year, let’s see if we can calculate the security score for San Francisco City Hall, which has a latitude of 37.7793° N and longitude of 122.4193° W.
Using some good old math tricks (radius times angle in radians to get arc length, approximating arc length as straight-line distance, and Pythagorean theorem), we can compute the distance in miles to each past incident:
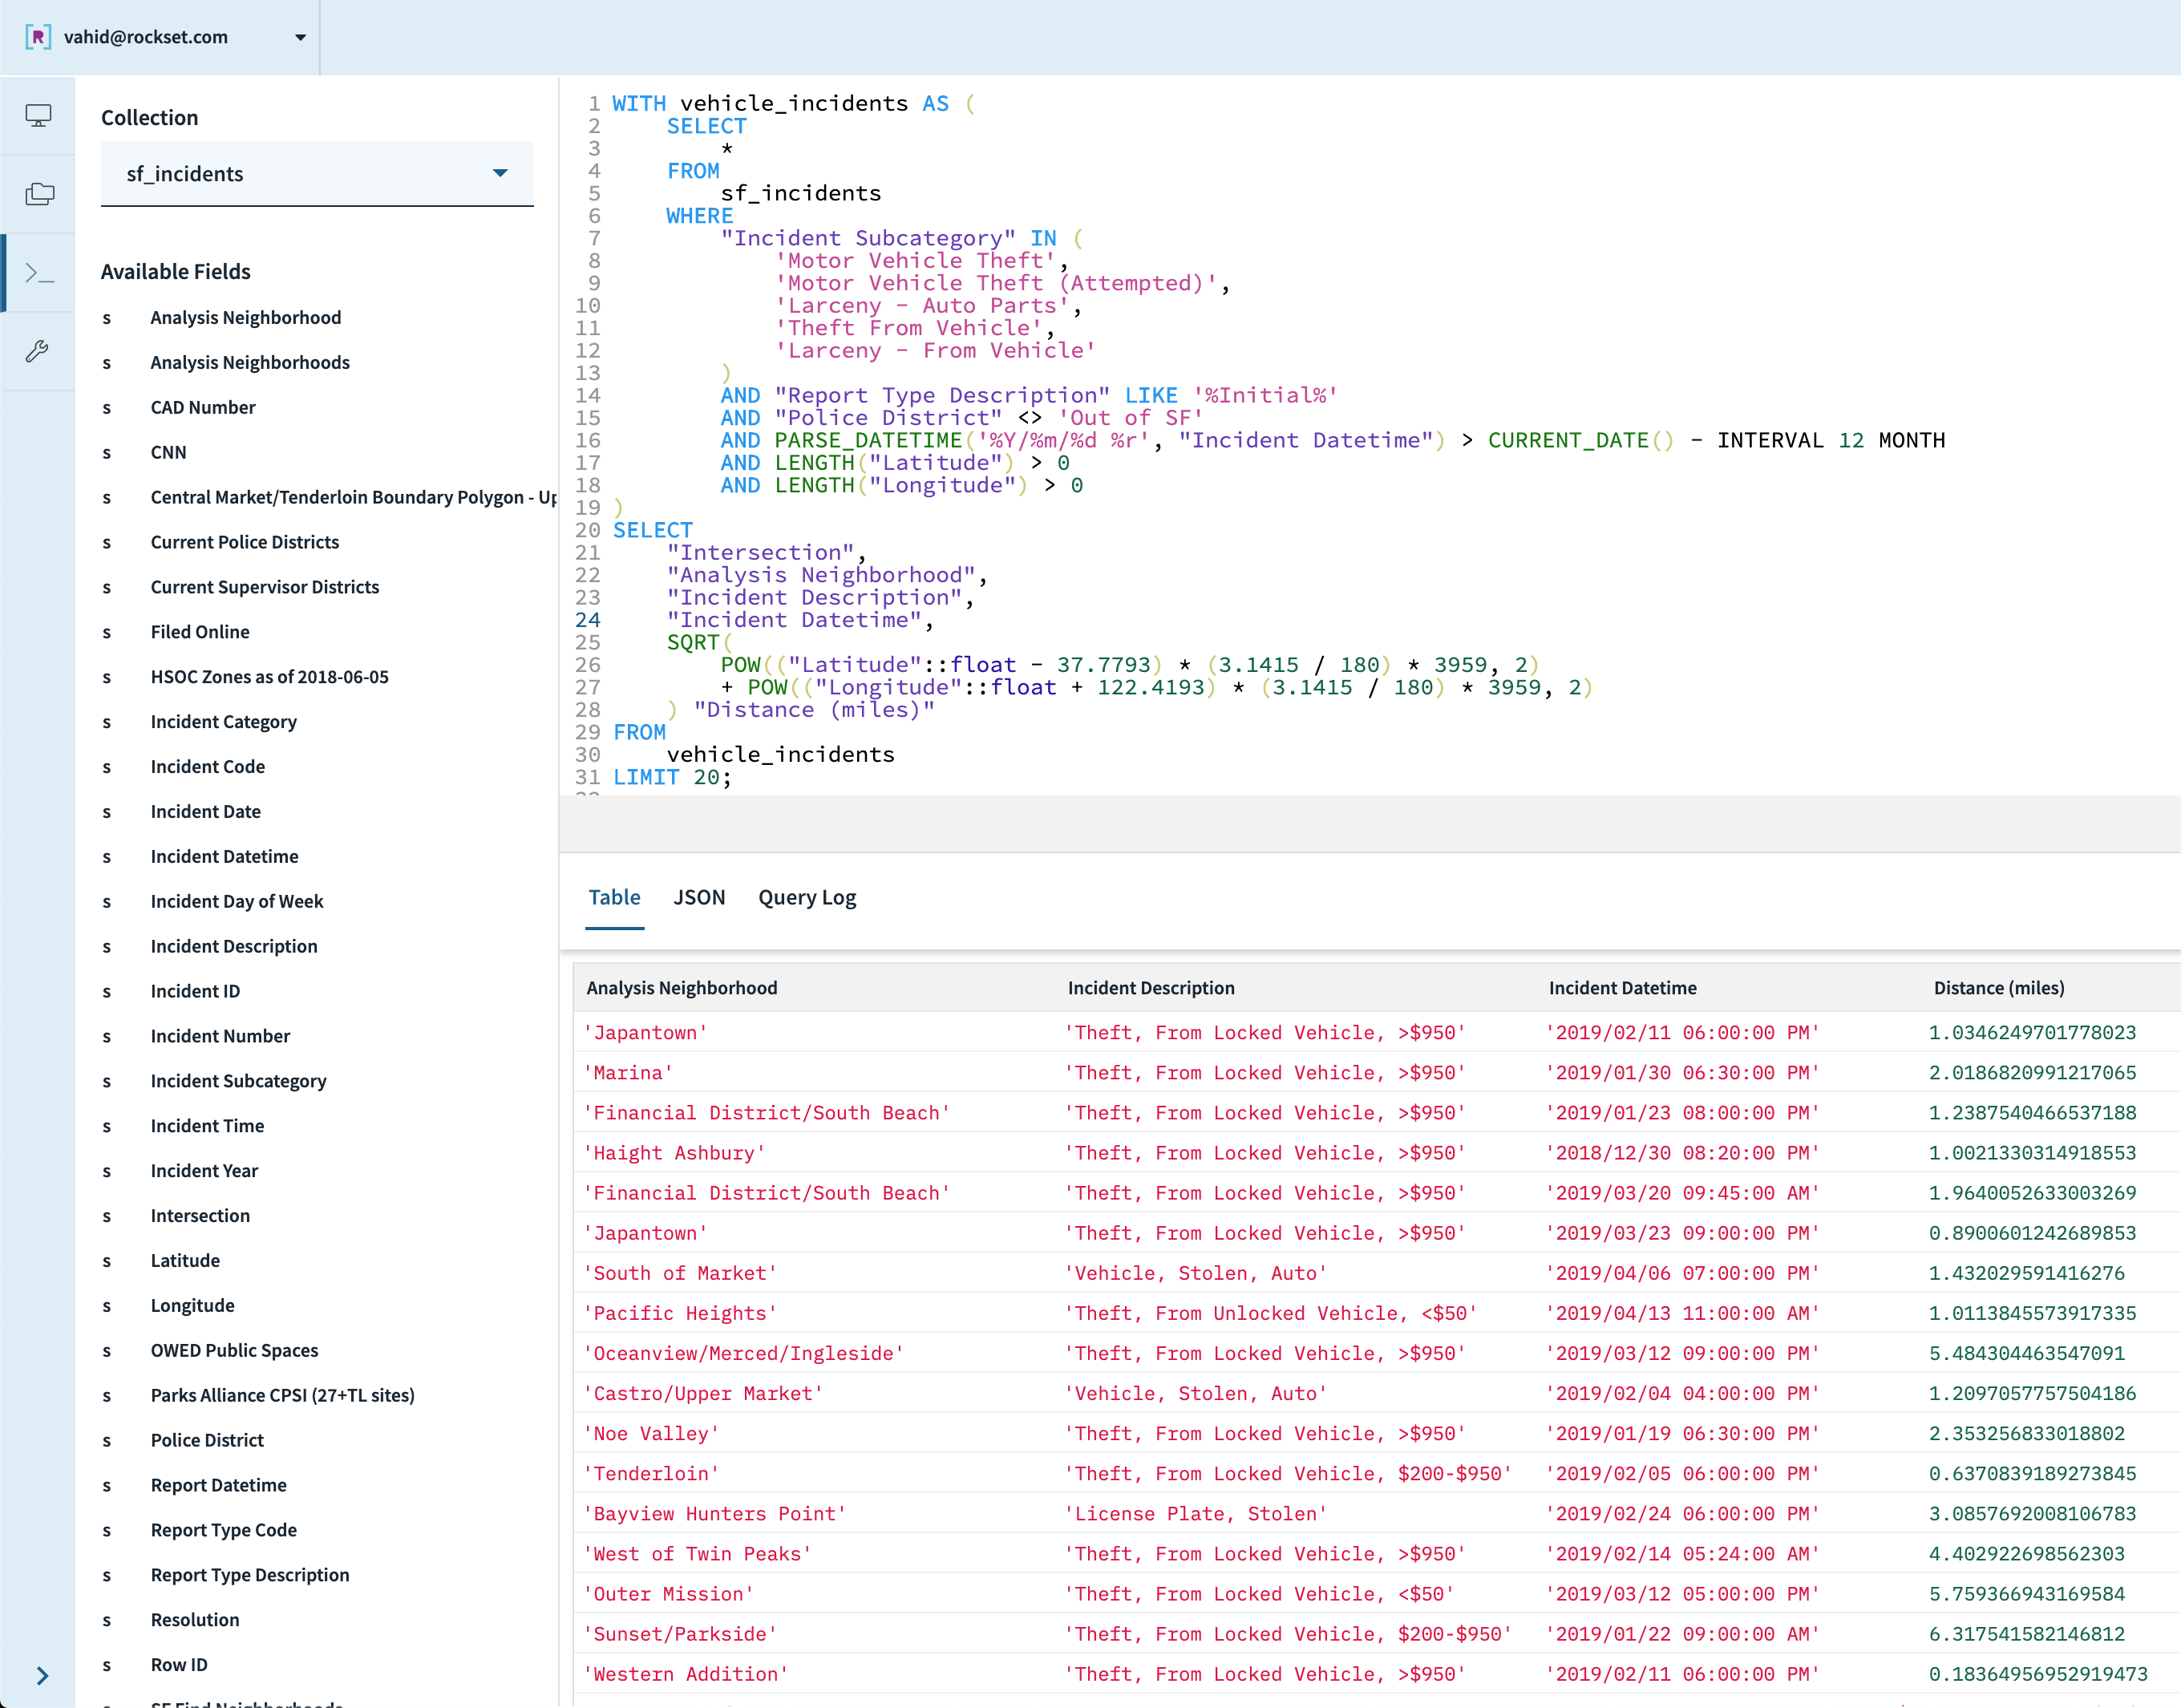
We aggregate these distances using our formula from above, and voila!
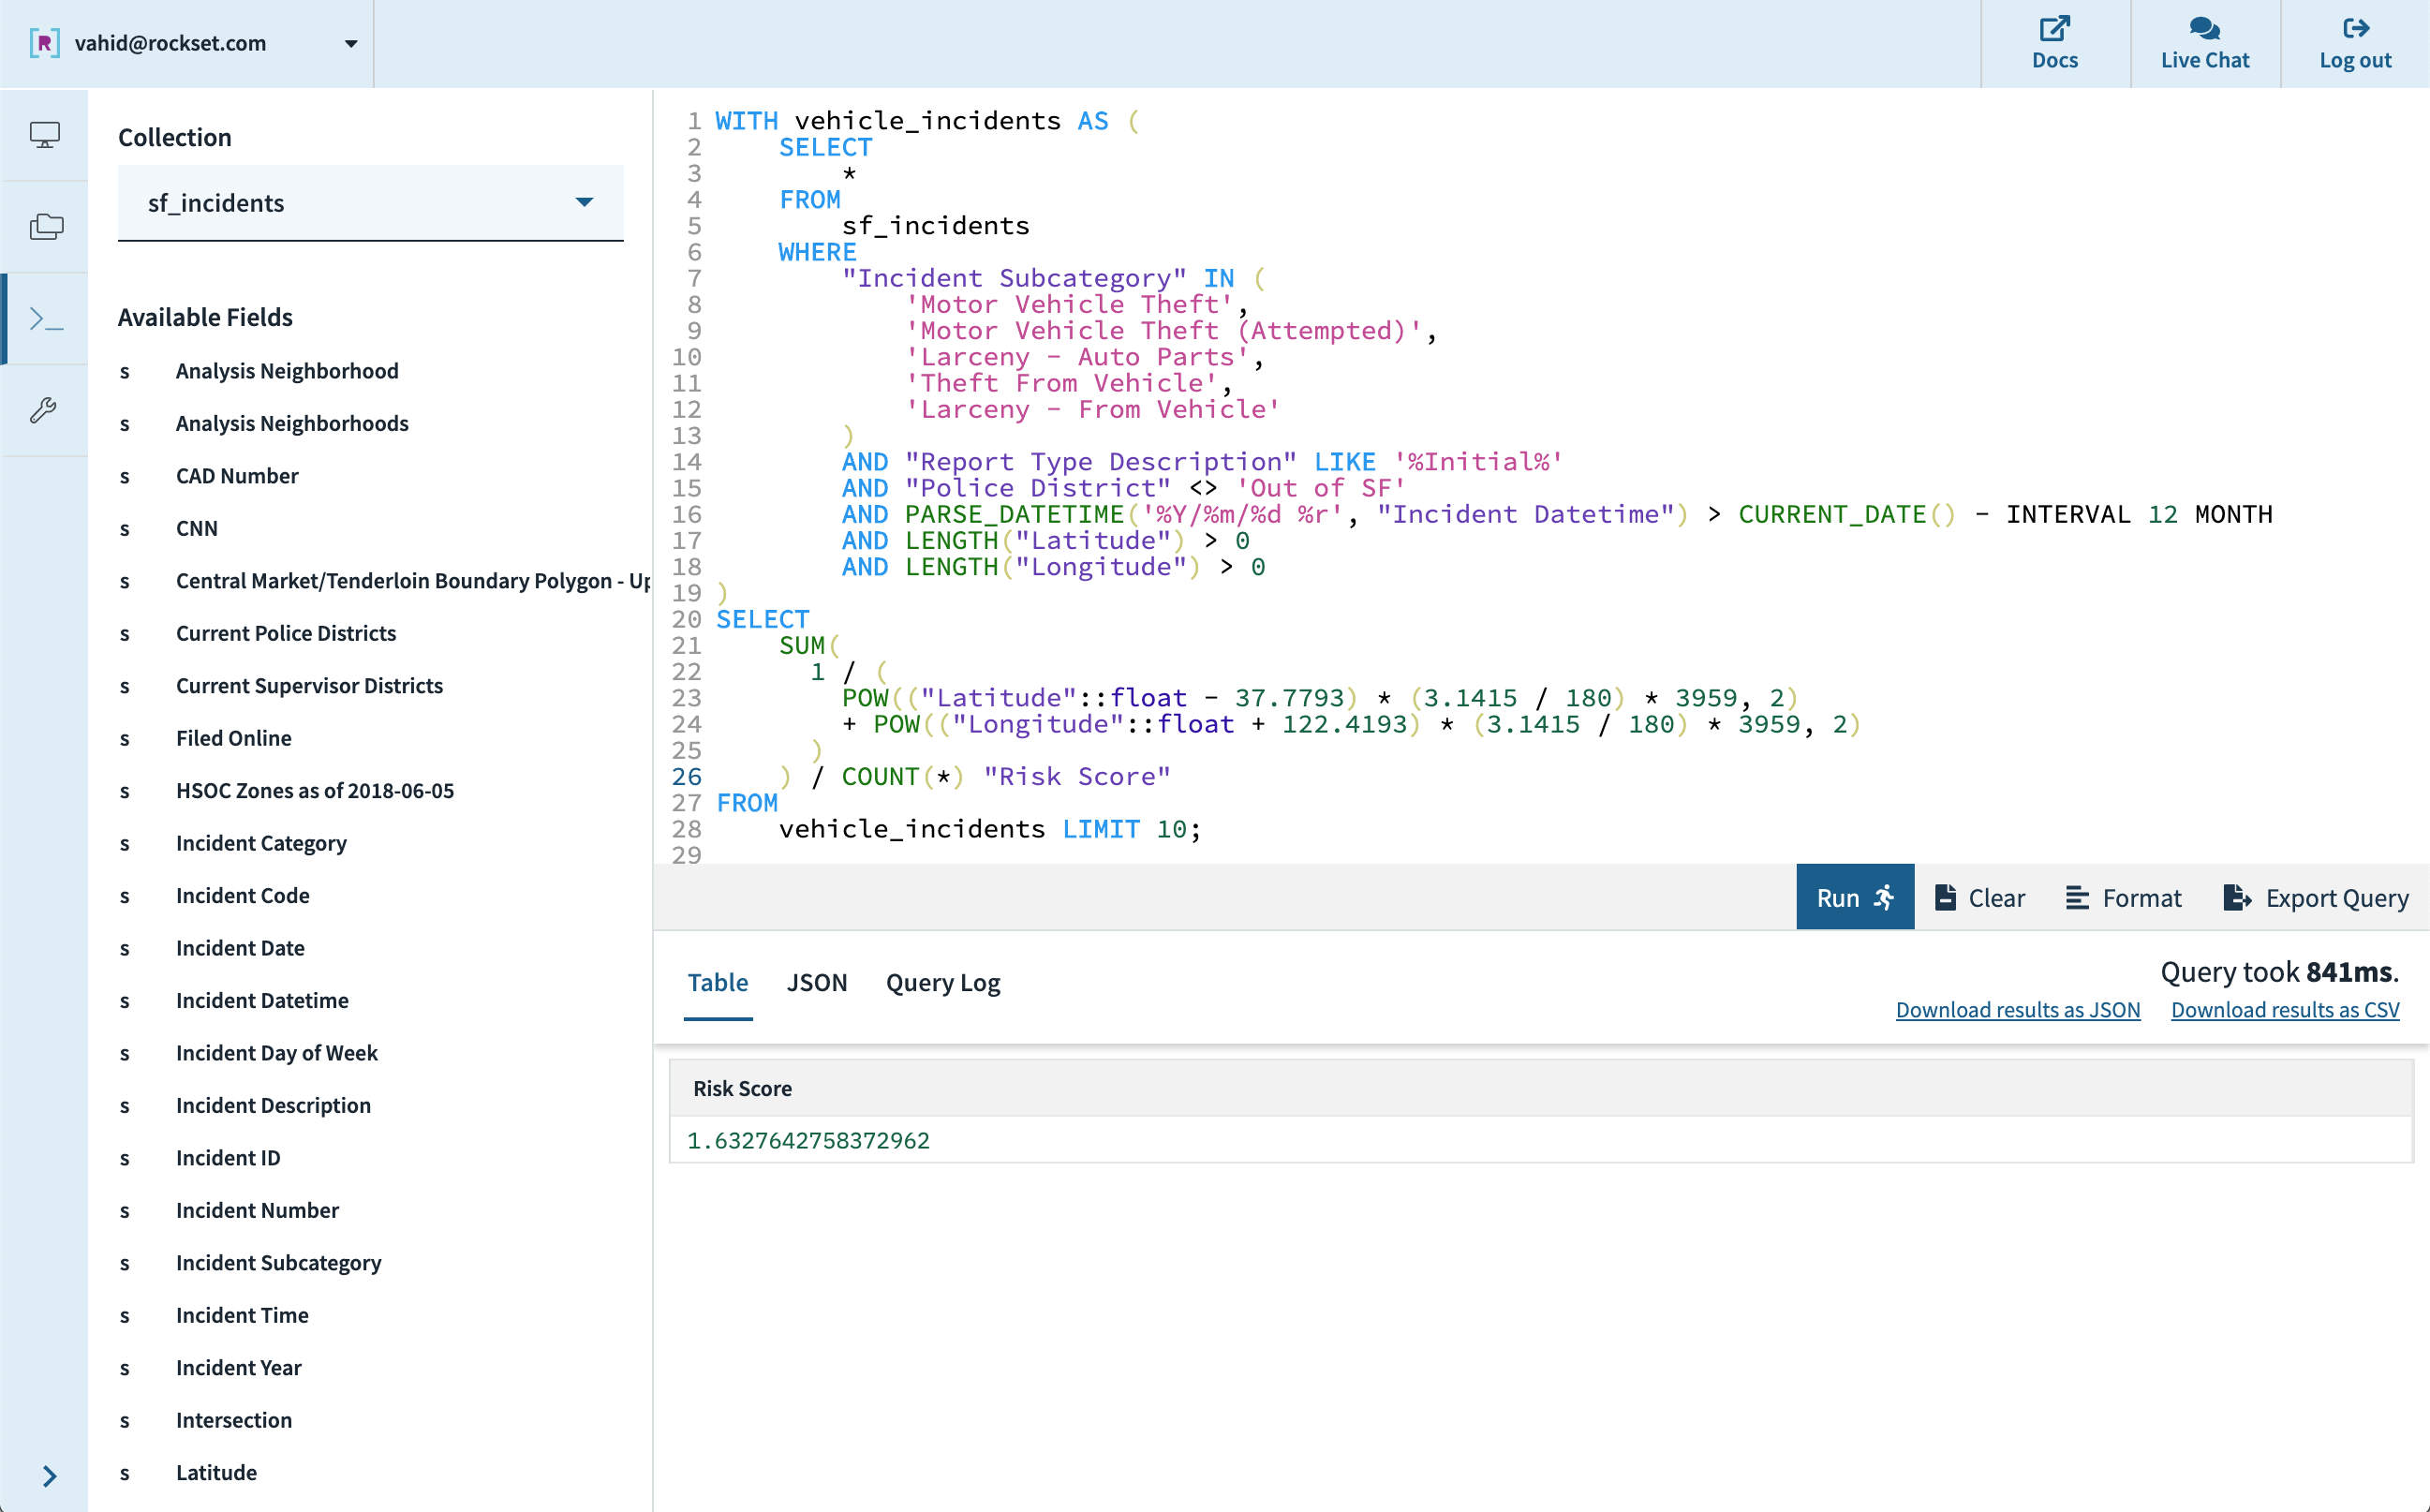
For our app, we will replace the latitude/longitude of City Hall with parameters coming from the user’s browser location.
Sample of Parking Spots in SF
So we can calculate a risk score—1.63 for City Hall—but that is meaningless unless we can compare it to the other parking spots in SF. We need to find a representative set of all possible parking spots in SF and compute the risk score for each to get a distribution of risk scores.
Turns out, the SFMTA has exactly what we need—field surveys are conducted to count the number of on-street parking spots and their results are published as an open dataset. We’ll upload this into Rockset as well!
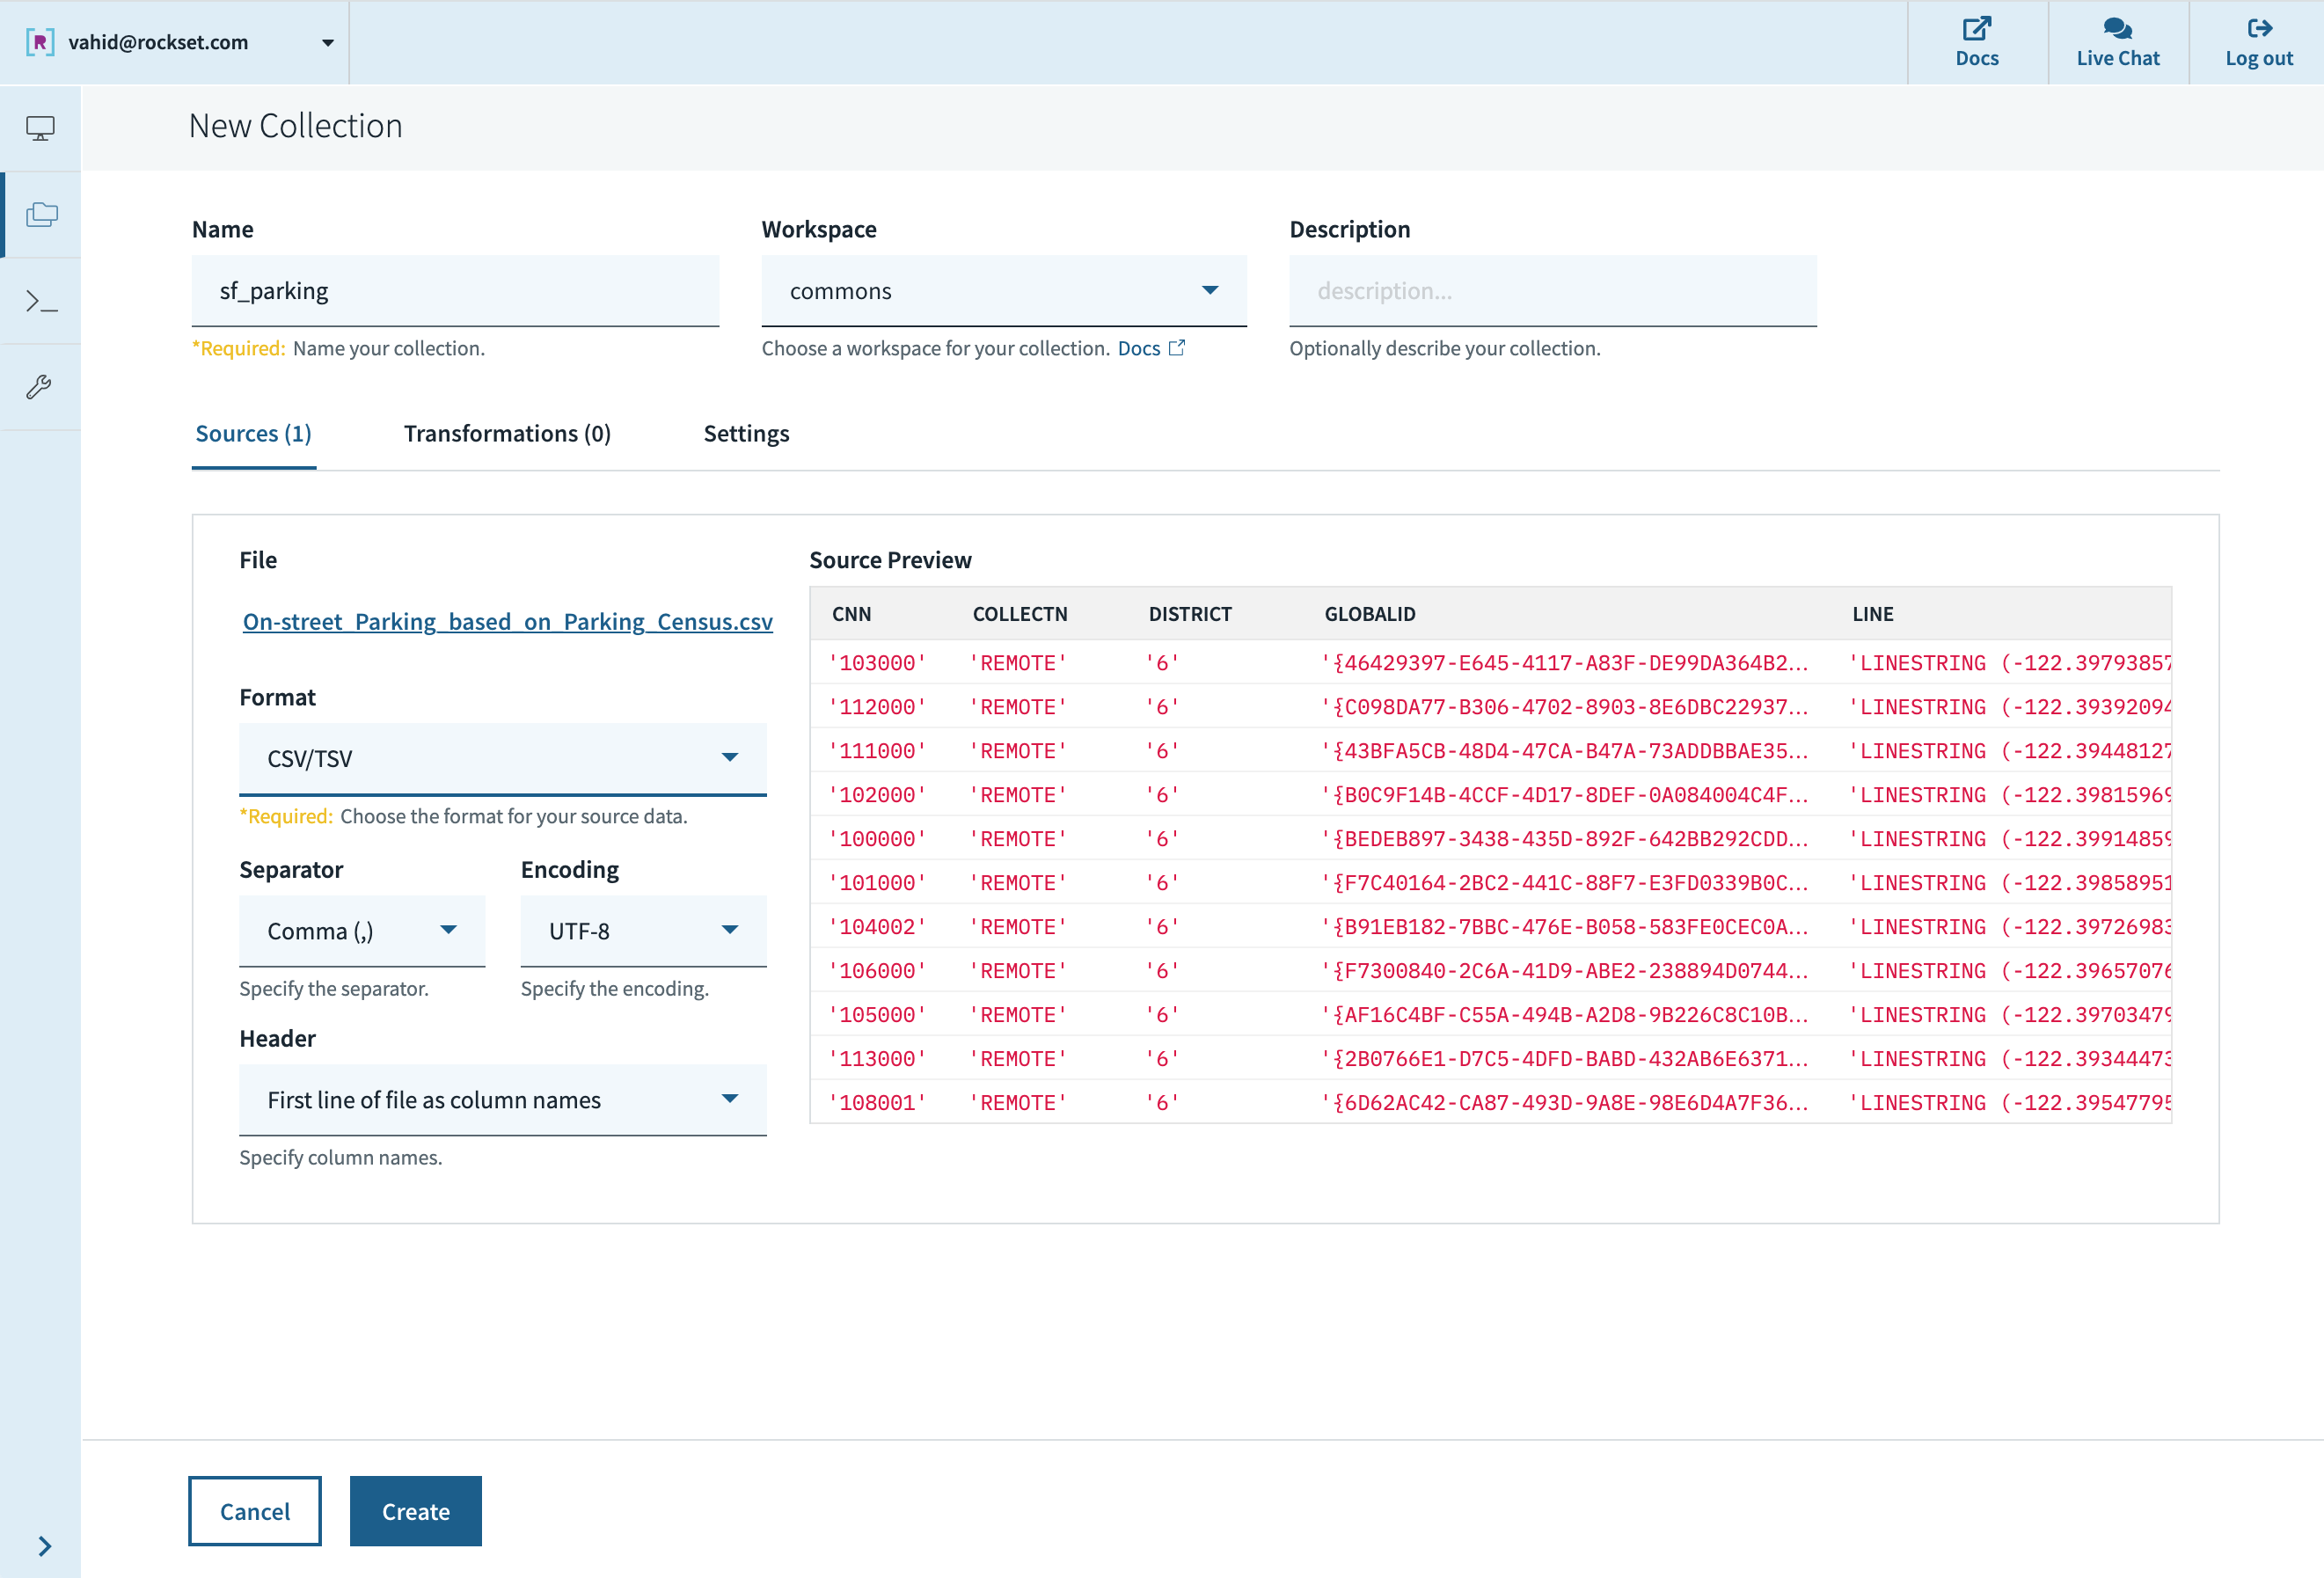
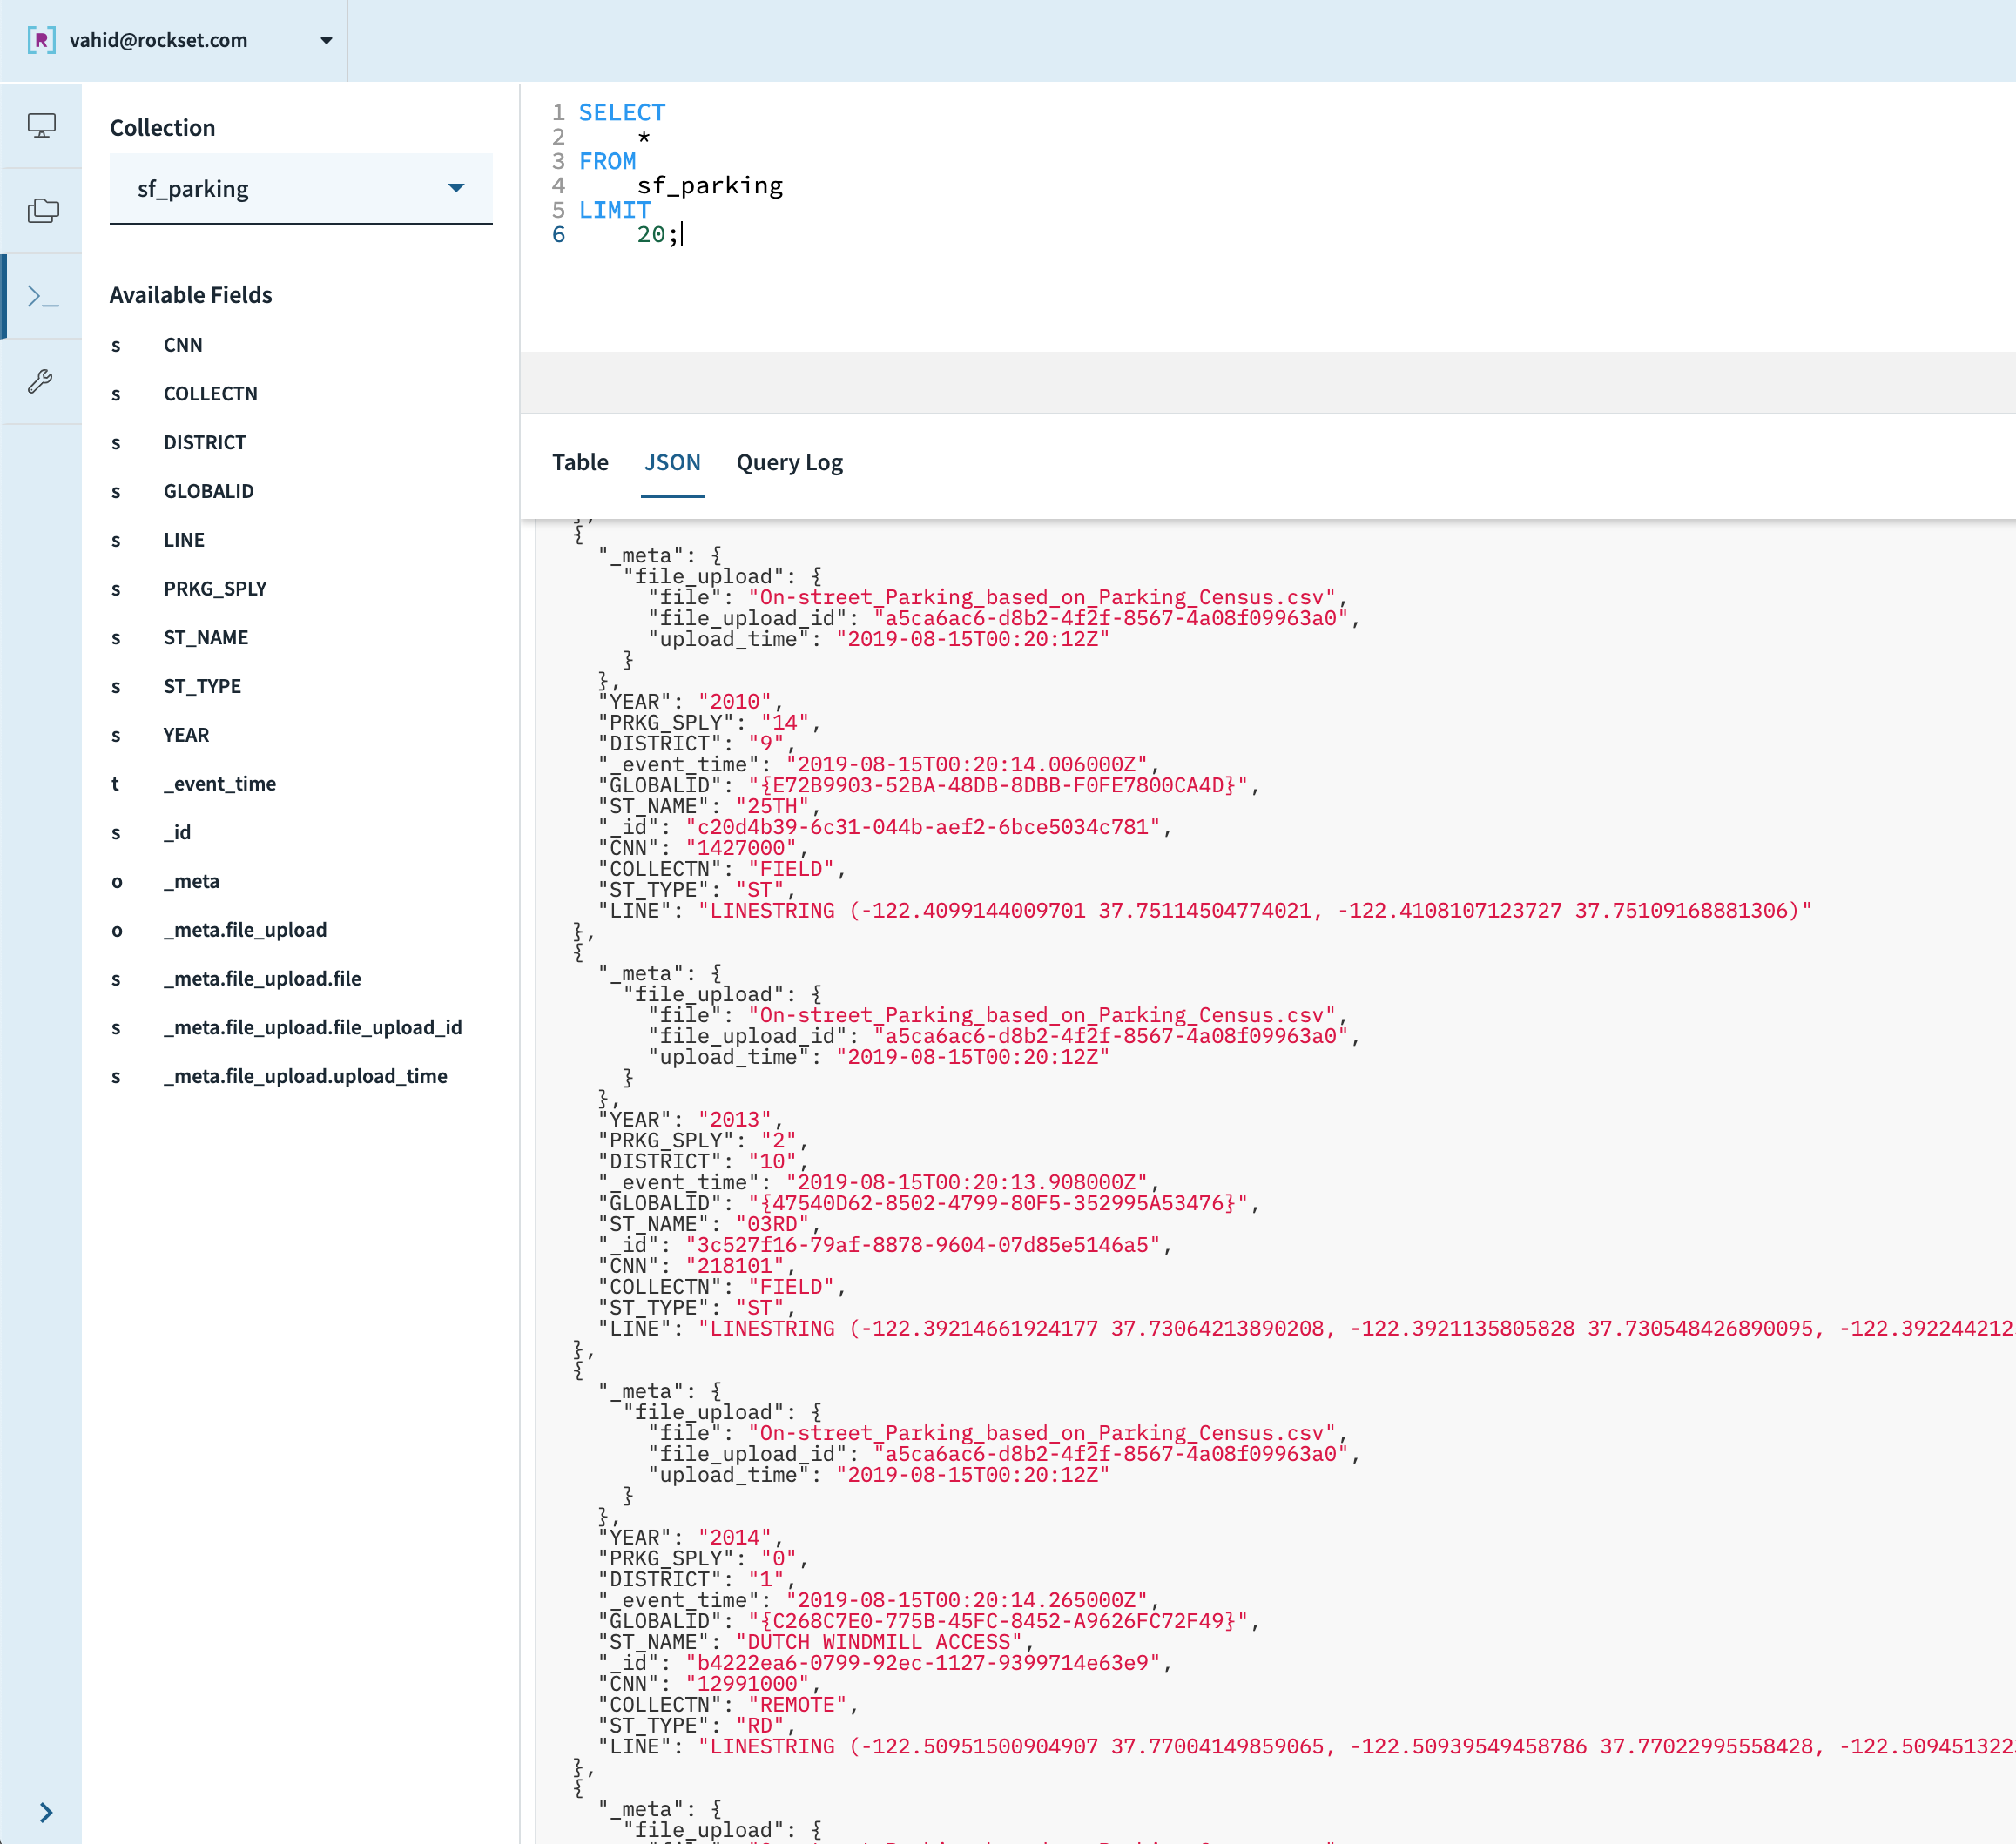
Let’s see what this dataset contains:
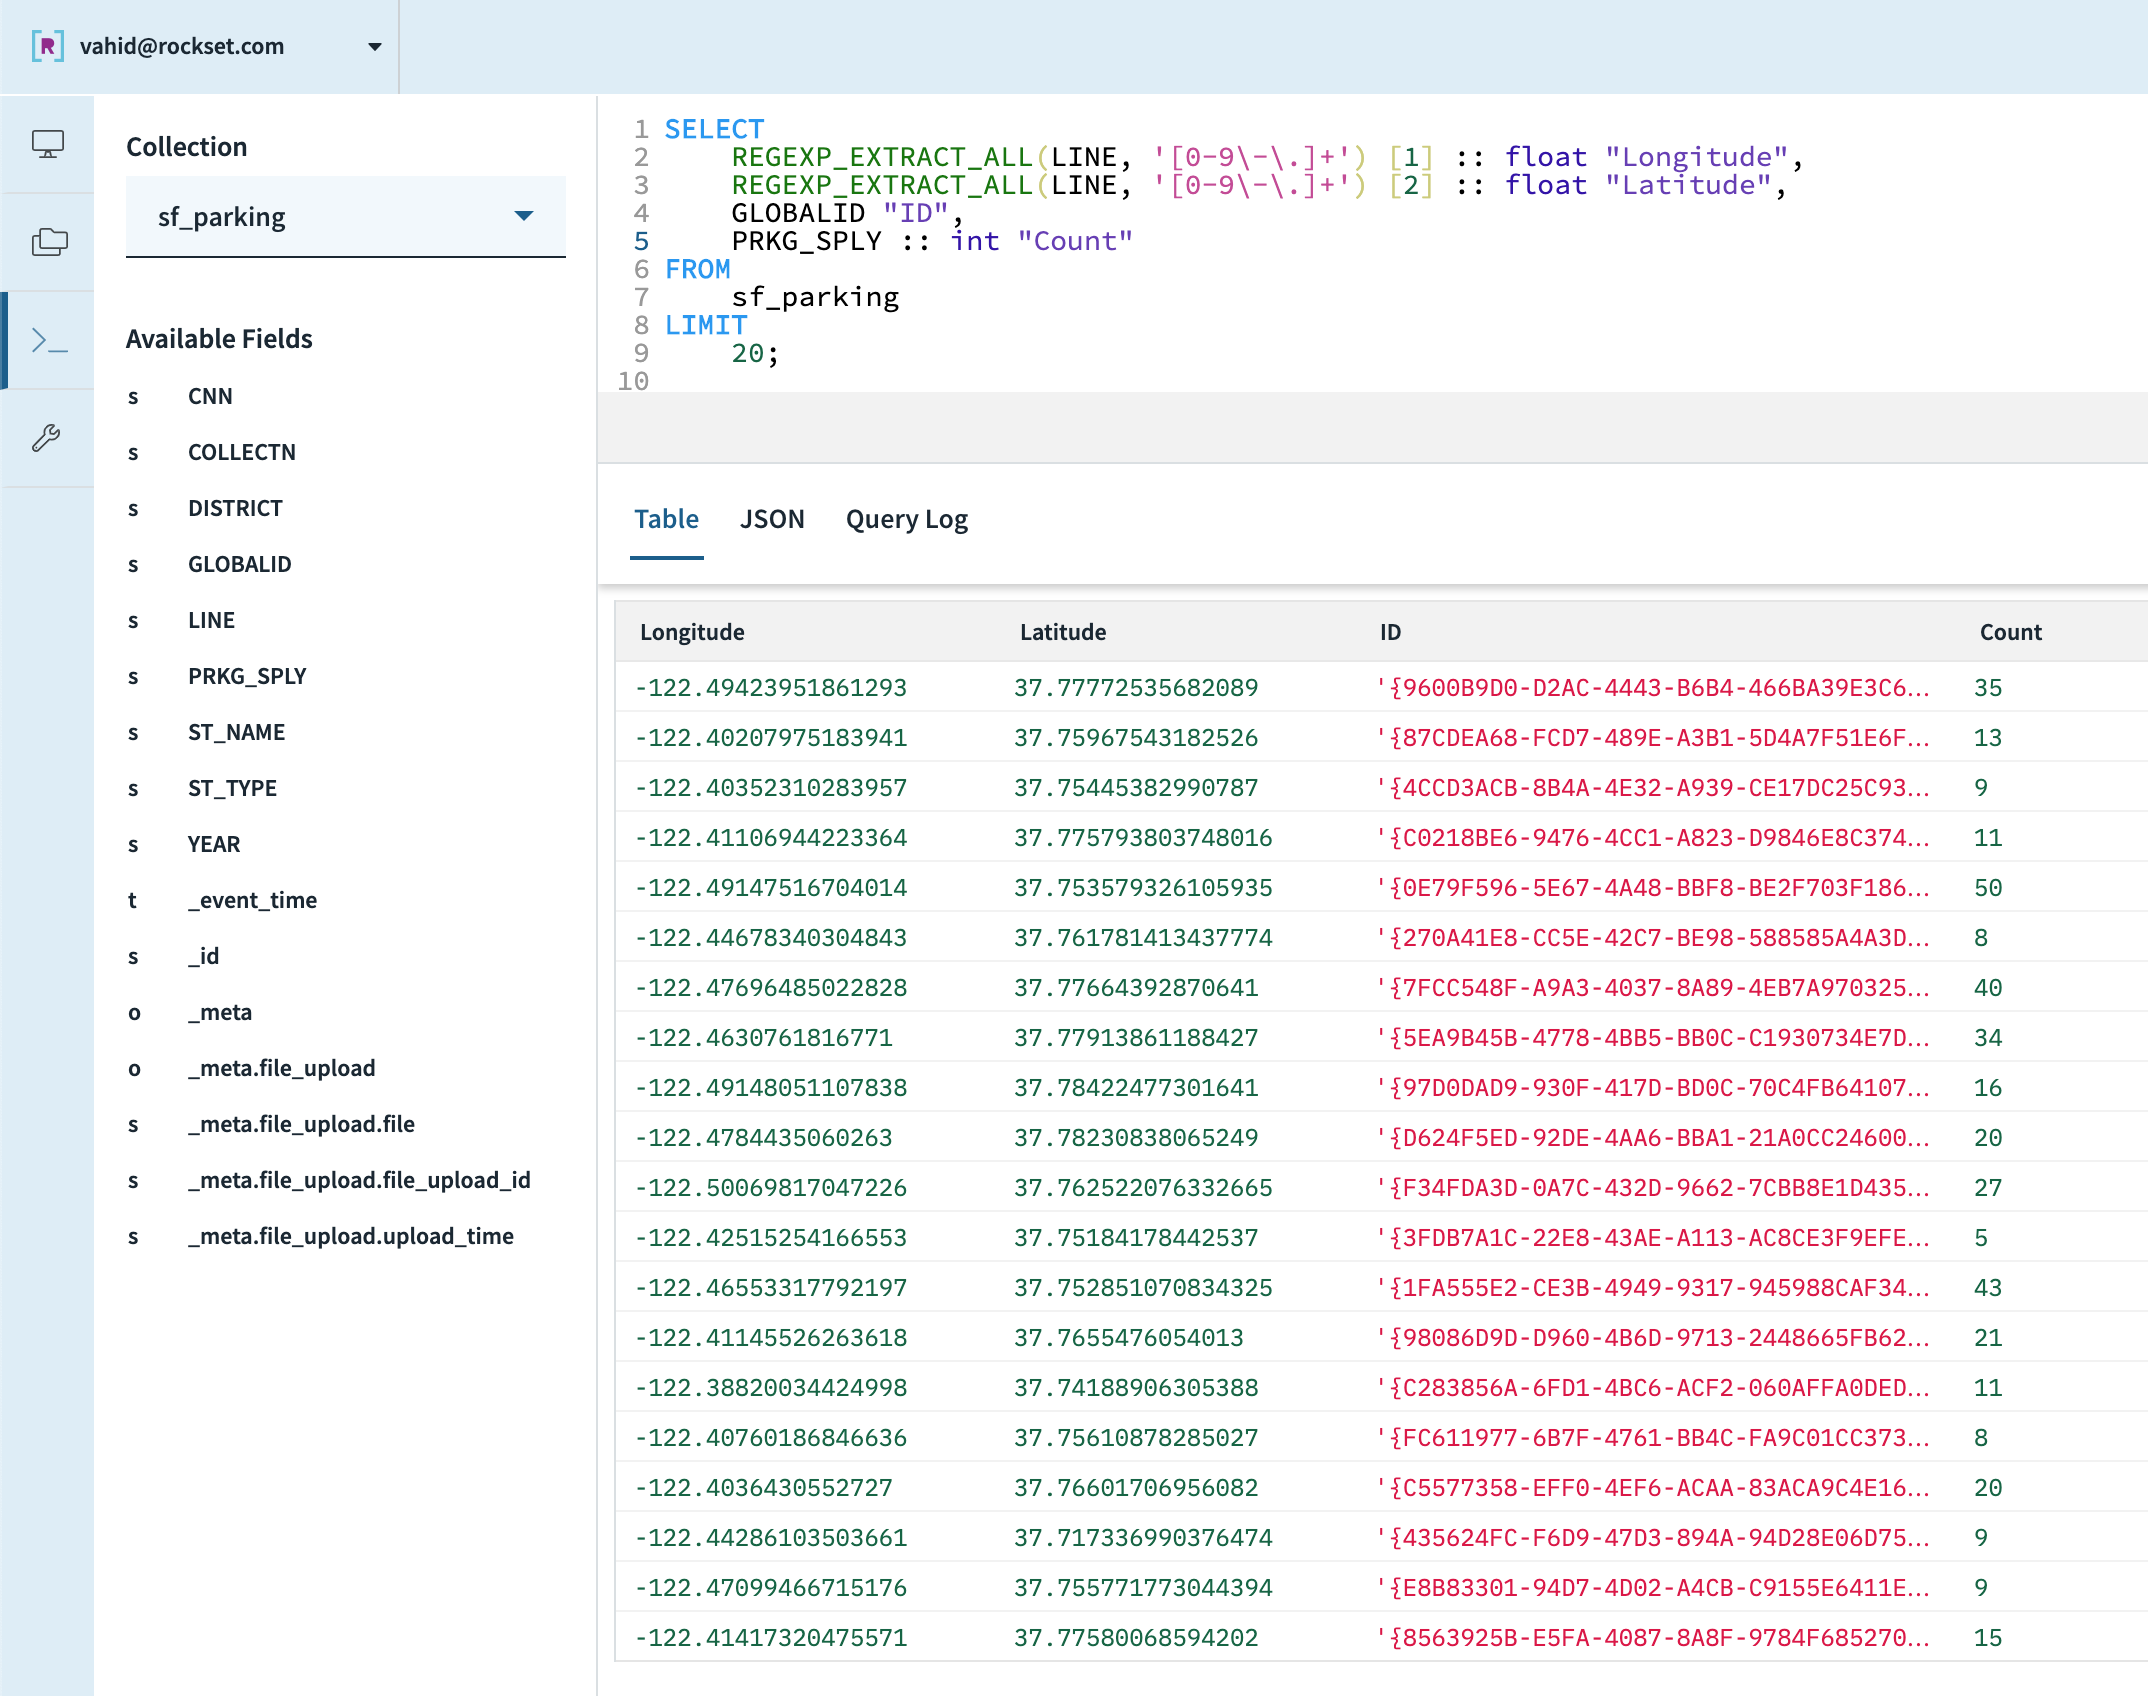
For each street, let’s pull out the latitude/longitude values (just the first point, close enough approximation), count of spots, and a unique identifier (casting types as necessary):
Calculating Risk Score, Every Spot in SF
Now, let’s try calculating a score for each of these points, just like we did above for City Hall:
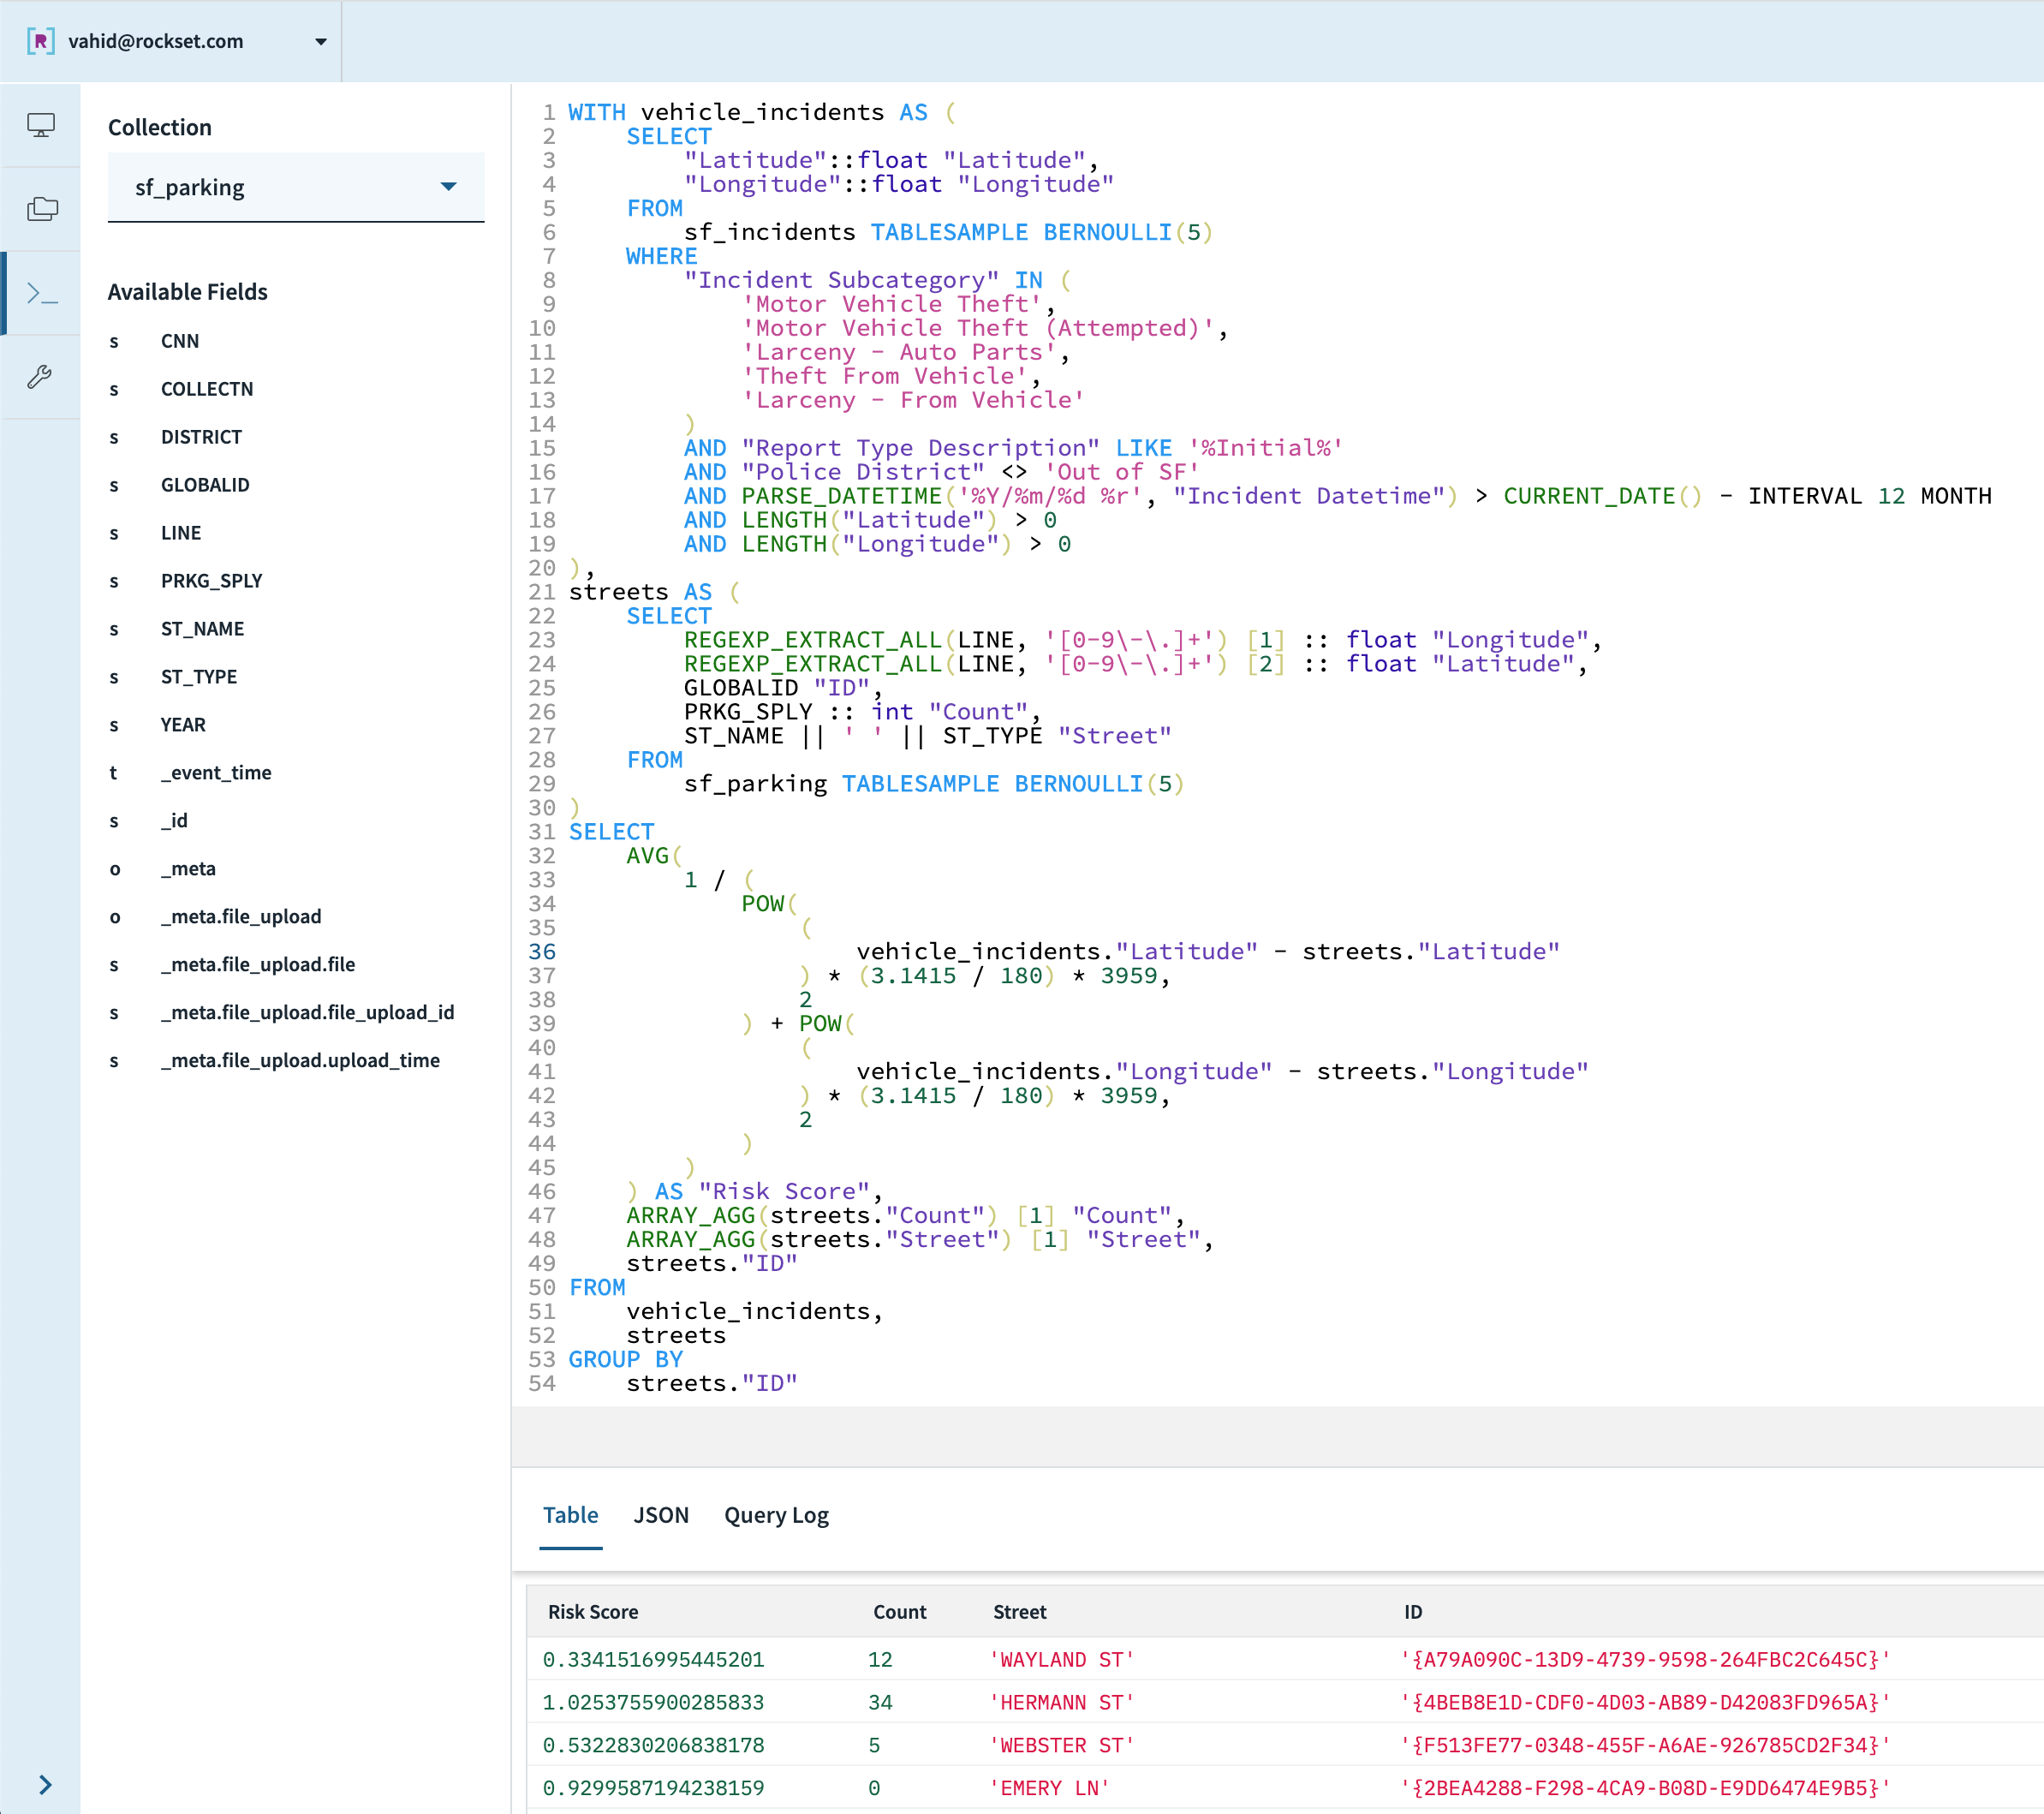
And there we have it! A parking risk score for each street segment in SF. This is a heavy query, so to lighten the load we’ve actually sampled 5% of each streets and incidents.
(Coming soon to Rockset: geo-indexing—watch out for a blog post about that in the coming weeks!)
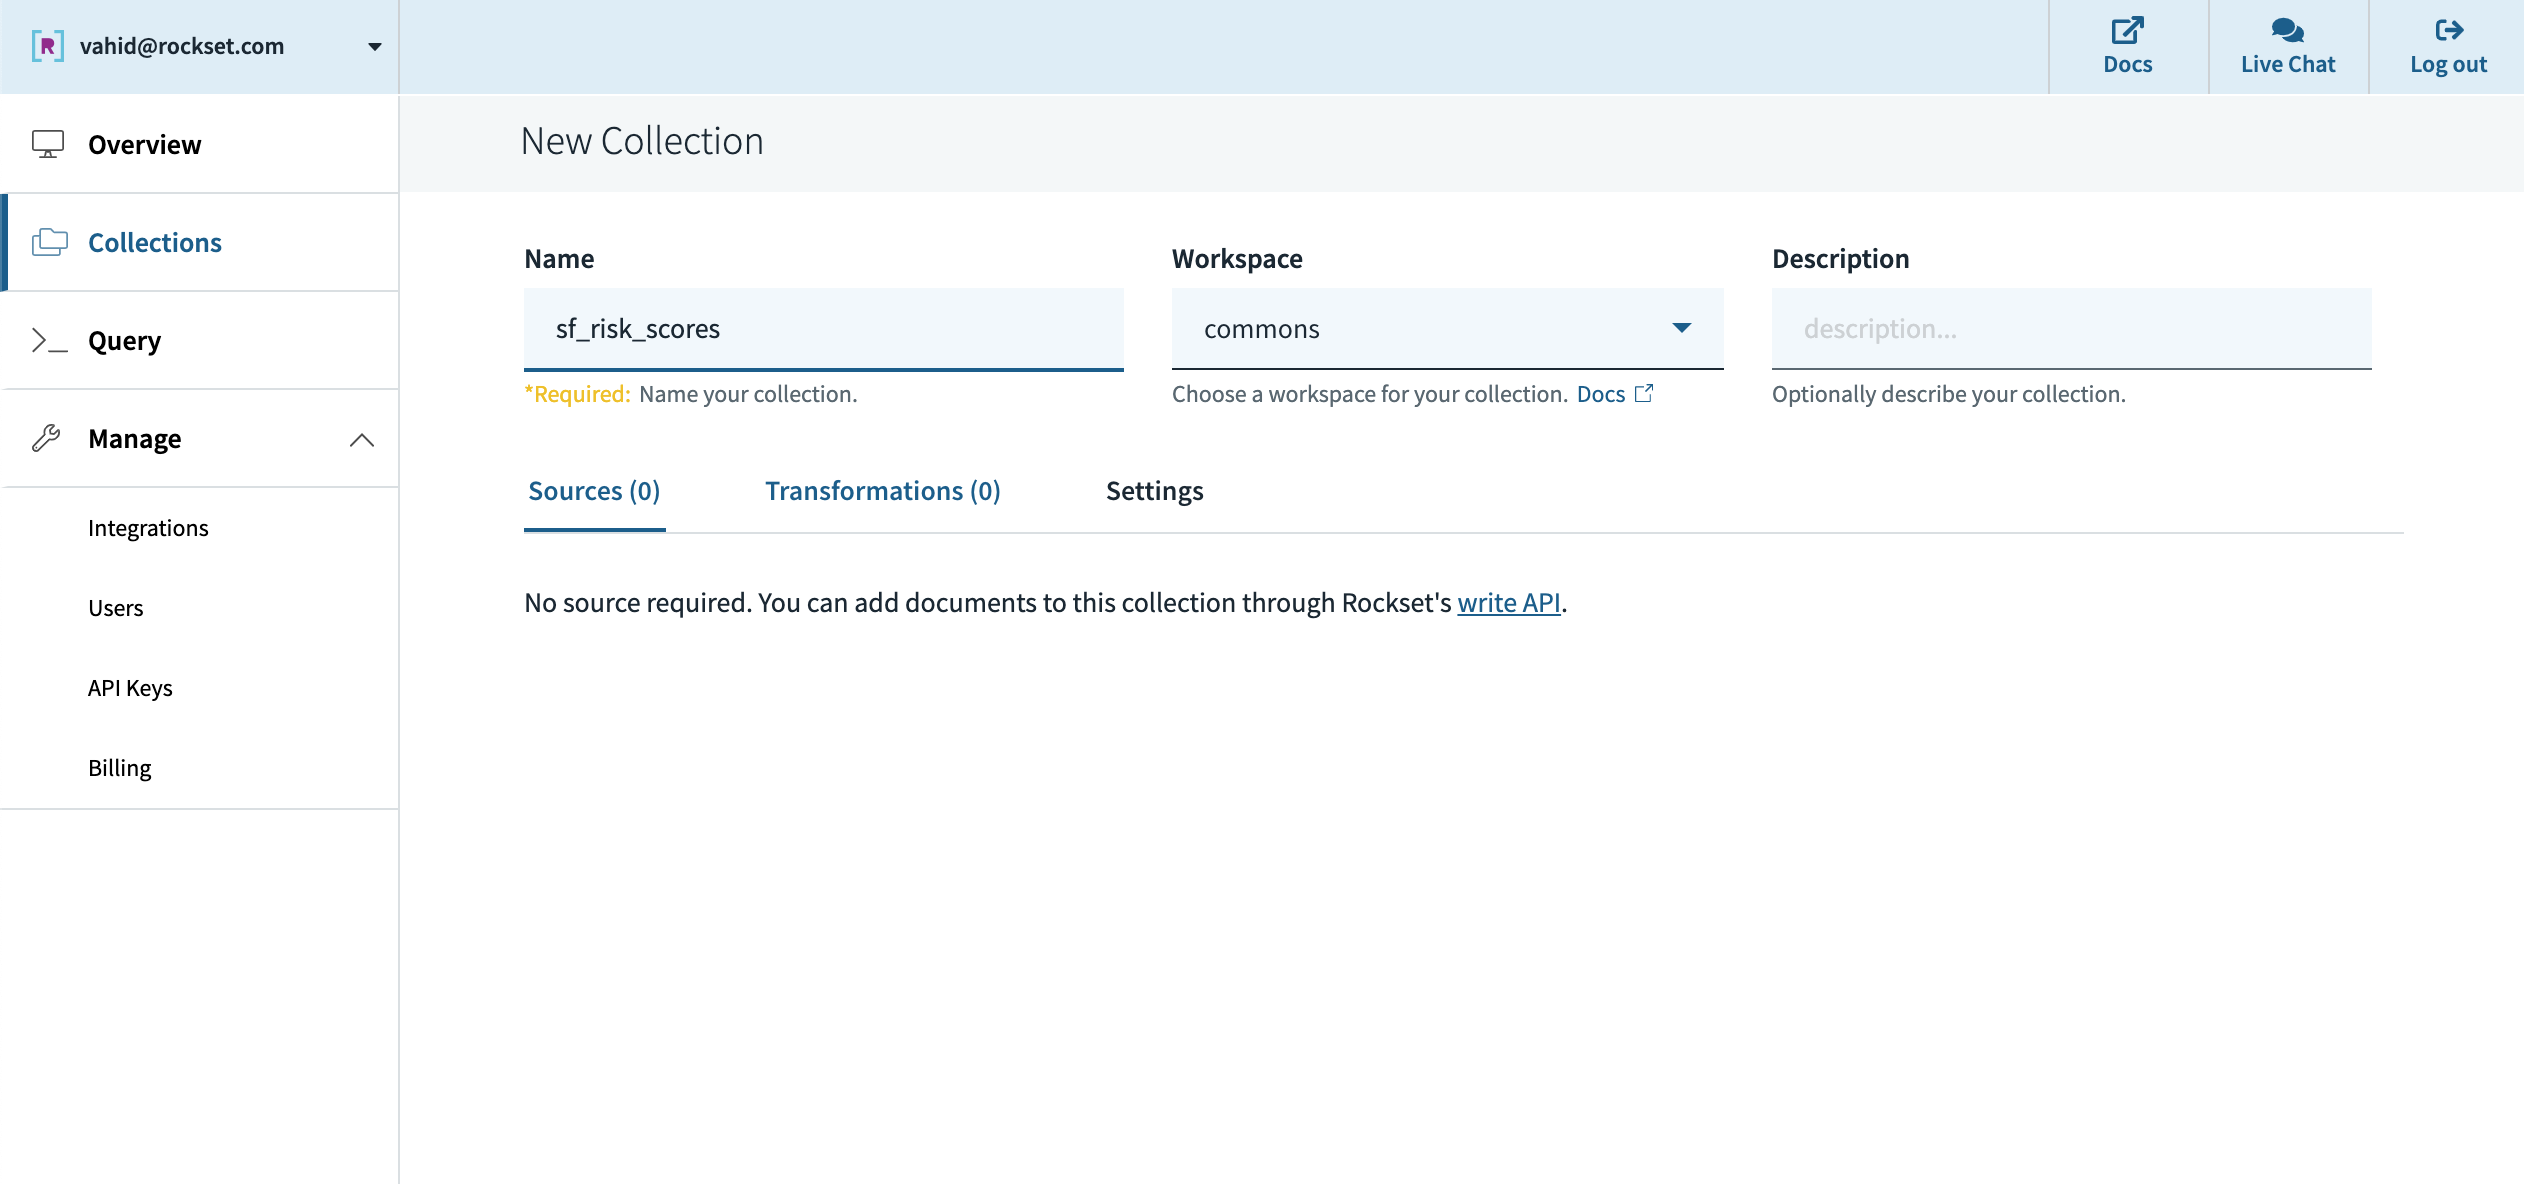
Let’s stash the results of this query in another collection so that we can use it to calculate percentiles. We first create a new empty collection:
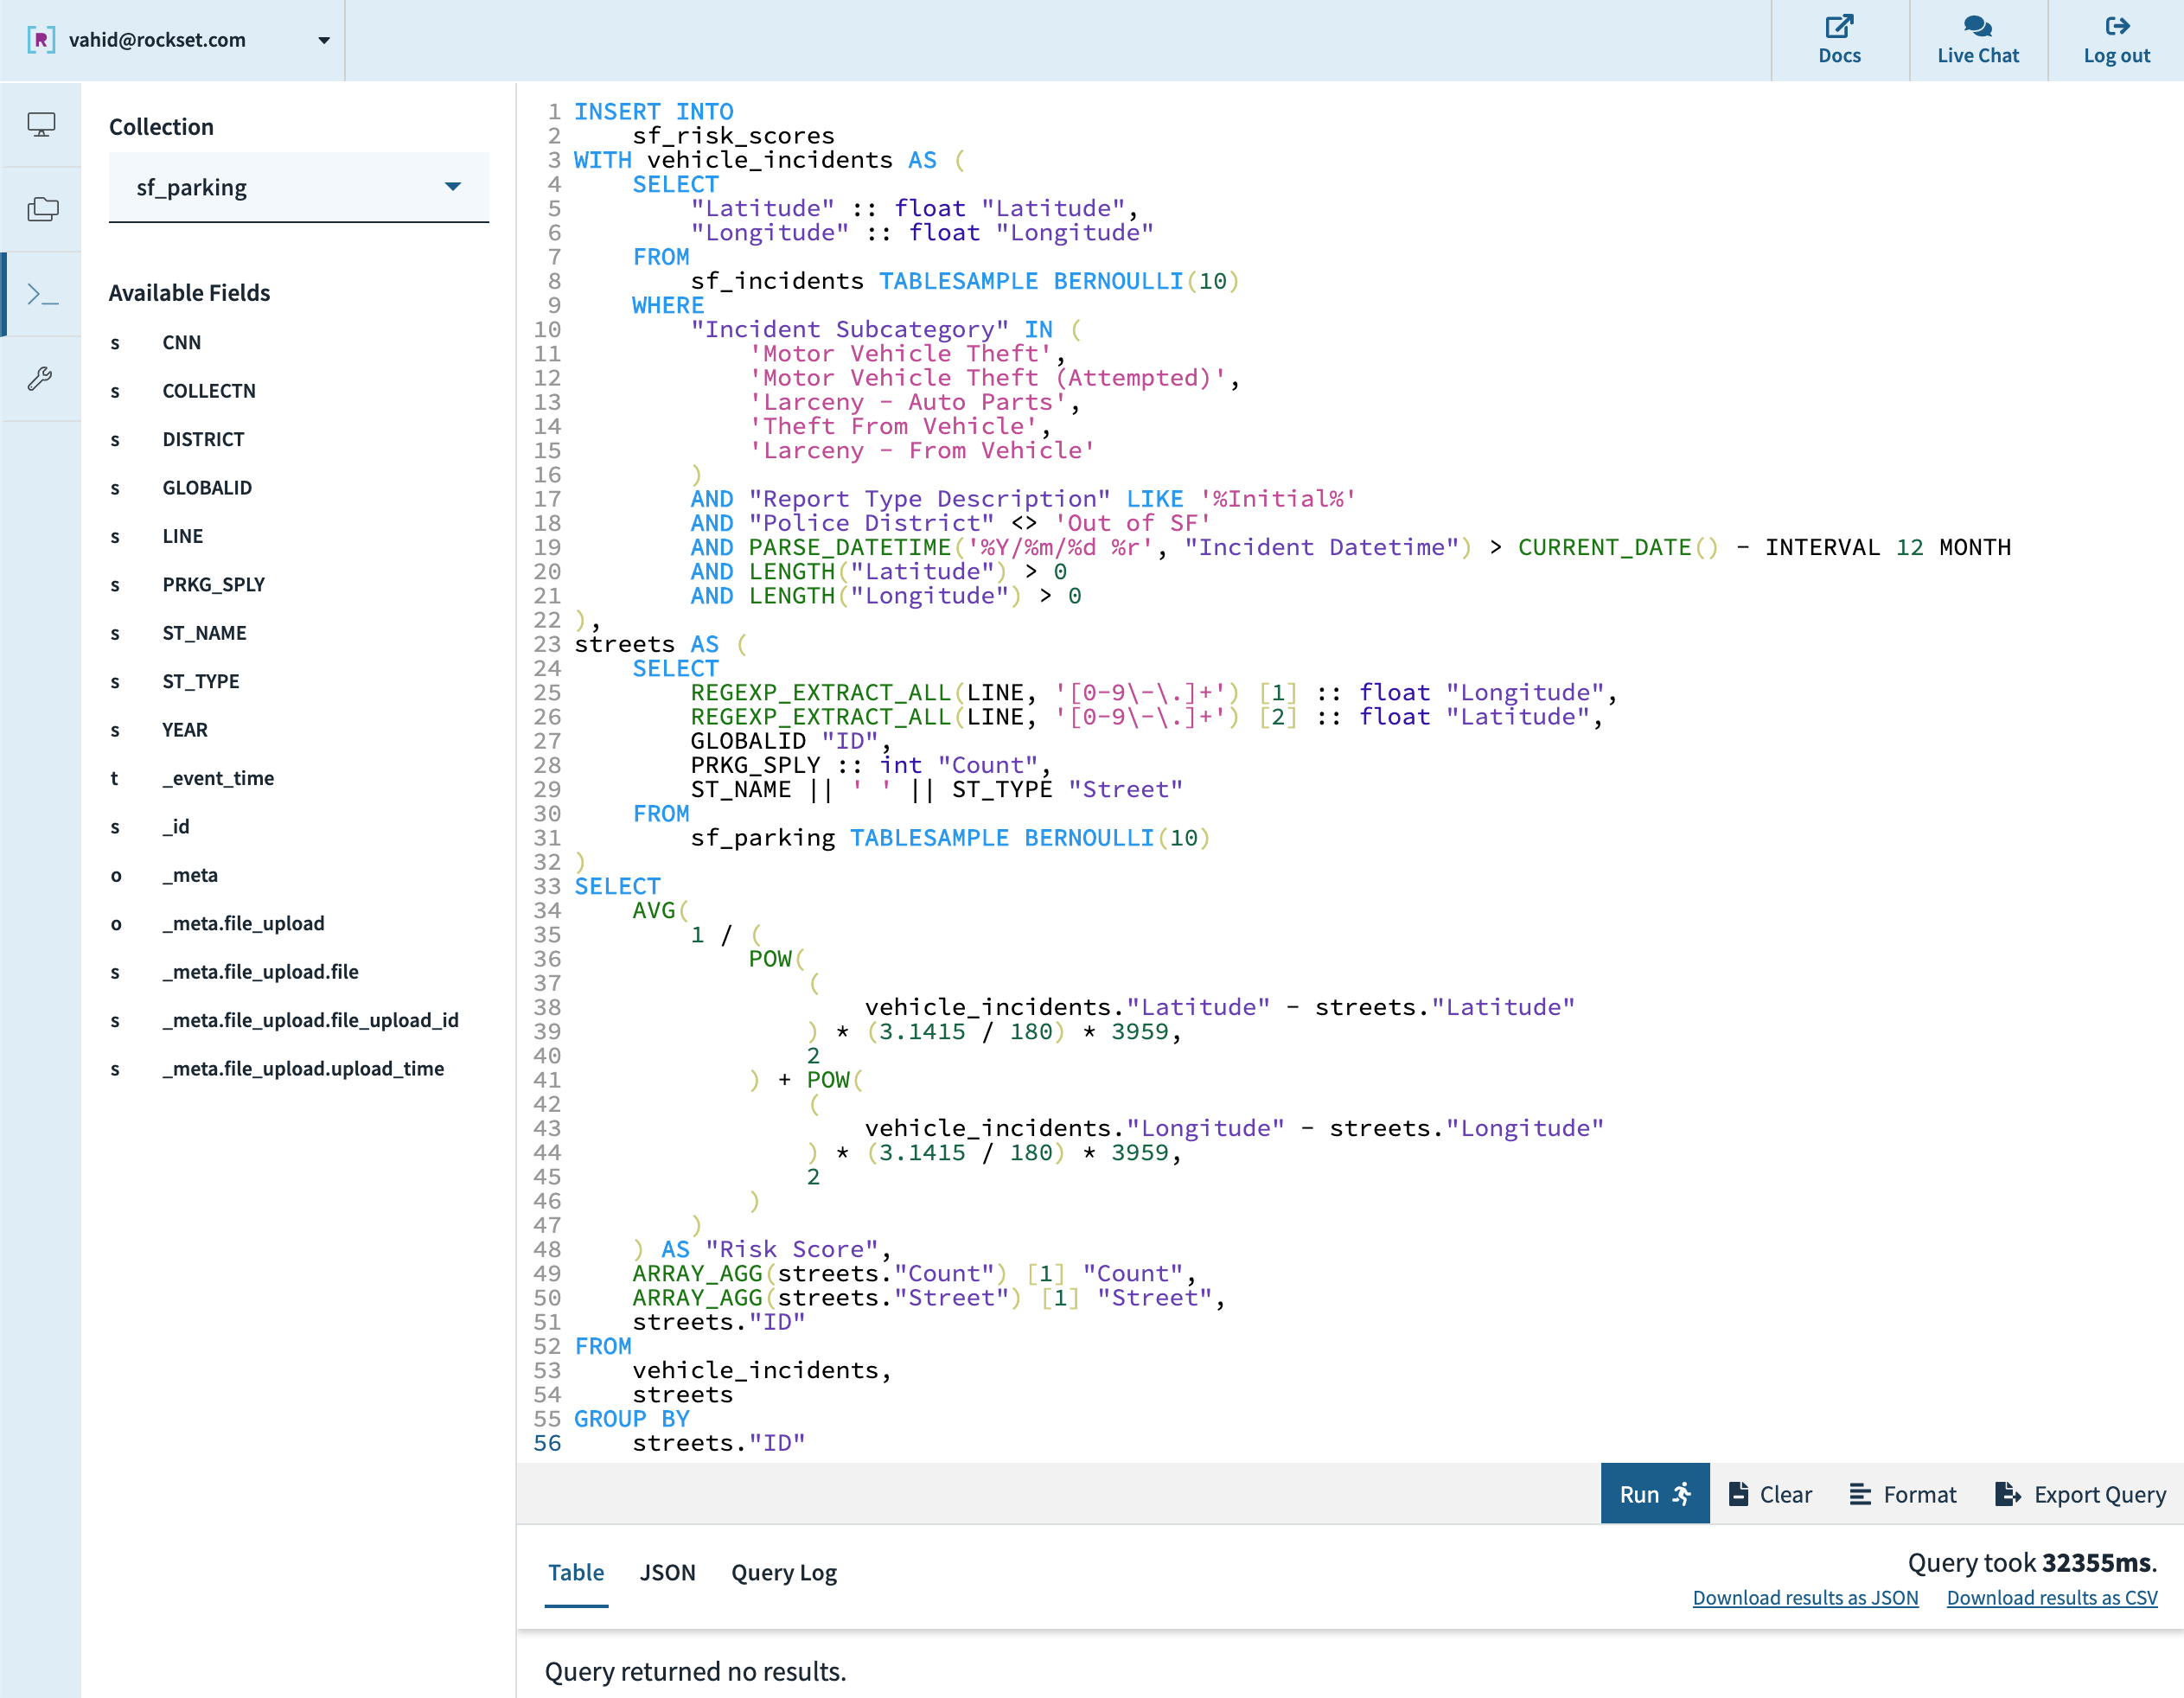
Now we run an INSERT INTO sf_risk_scores SELECT ... query, bumping up to 10% sampling on both incidents and streets:
Ranking Risk Score as Percentile
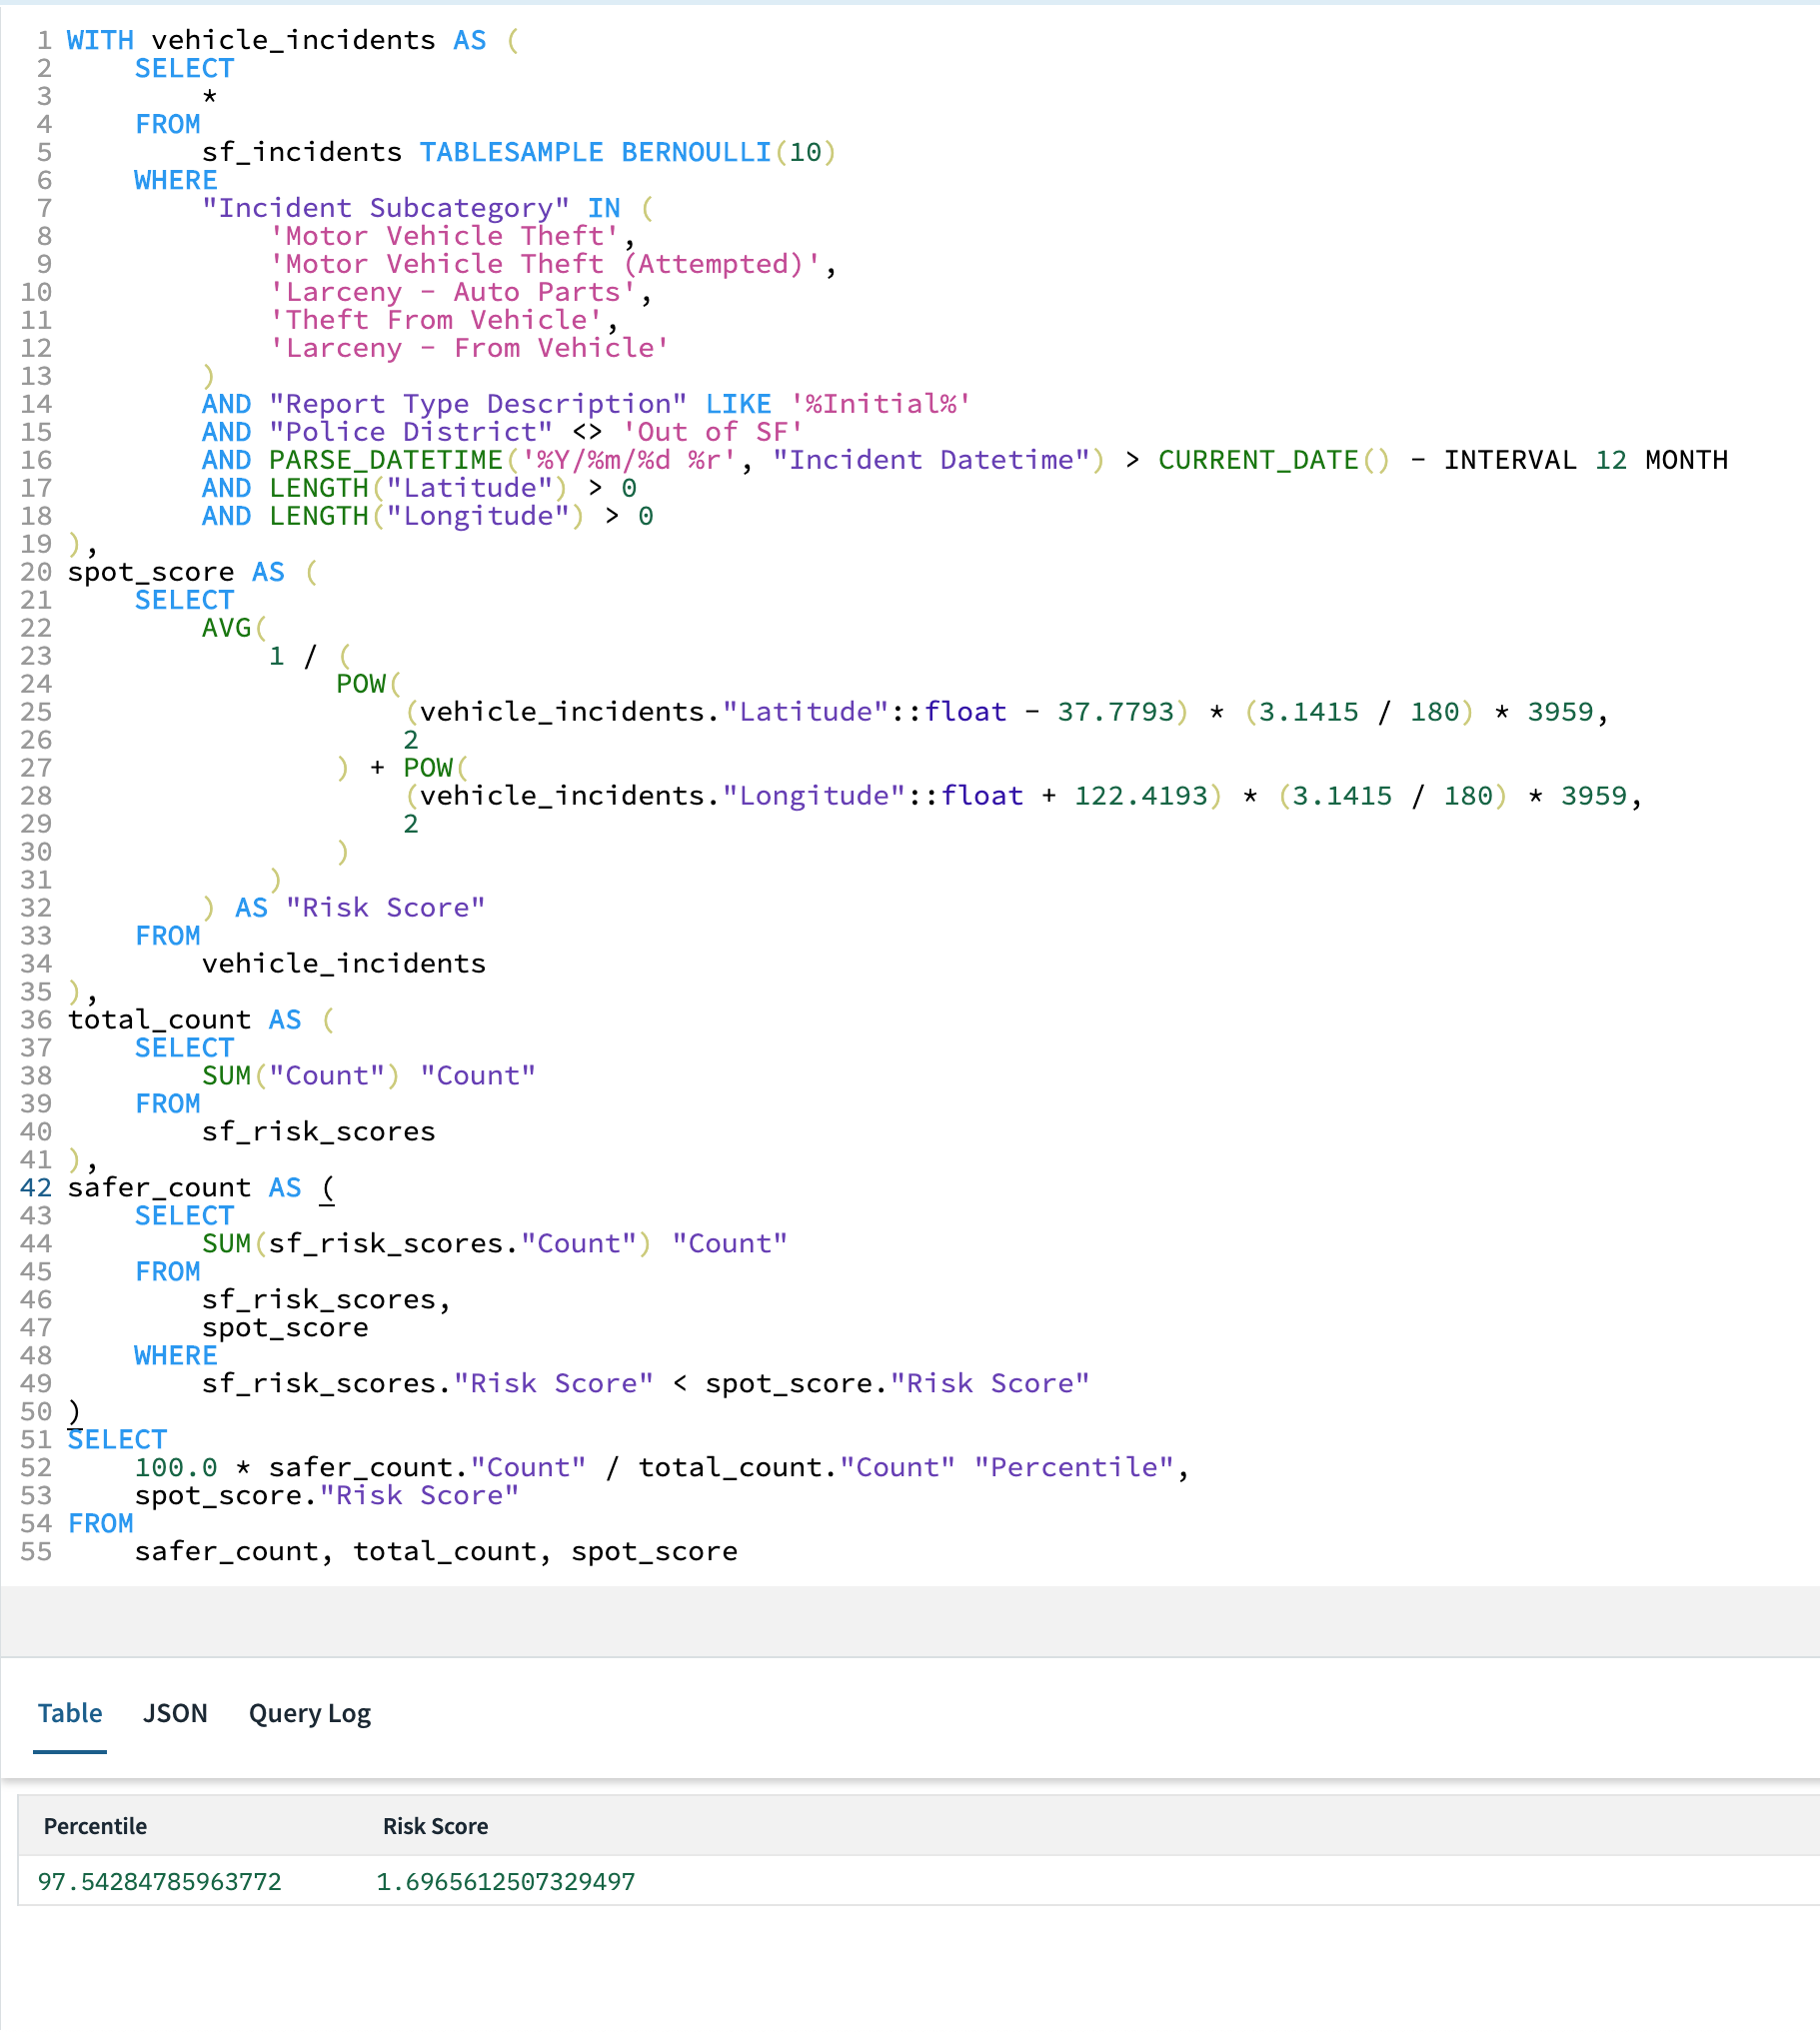
Now let’s get a percentile for City Hall against the sample we’ve inserted into sf_risk_scores. We keep our spot score calculation as we had at first, but now also count what percent of our sampled parking spots are safer than the current spot.
Parking-Spot-Risk-Score-as-a-Service
Now that we have an arguably useful query, let’s turn it into an app!
We’ll keep it simple—we’ll create an AWS Lambda function that will serve two types of requests. On GET requests, it will serve a local index.html file, which serves as the UI. On POST requests, it will parse query params for lat and lon and pass them on as parameters in the last query above. The lambda code looks like this:
import json
from botocore.vendored import requests
import os

ROCKSET_APIKEY = os.environ.get('ROCKSET_APIKEY')
QUERY_TEXT = """
WITH vehicle_incidents AS (
    SELECT
        *
    FROM
        sf_incidents TABLESAMPLE BERNOULLI(10)
    WHERE
        "Incident Subcategory" IN (
            'Motor Vehicle Theft',
            'Motor Vehicle Theft (Attempted)',
            'Larceny - Auto Parts',
            'Theft From Vehicle',
            'Larceny - From Vehicle'
        )
        AND "Report Type Description" LIKE '%Initial%'
        AND "Police District" <> 'Out of SF'
        AND PARSE_DATETIME('%Y/%m/%d %r', "Incident Datetime") > CURRENT_DATE() - INTERVAL 12 MONTH
        AND LENGTH("Latitude") > 0
        AND LENGTH("Longitude") > 0
),
spot_score AS (
    SELECT
        AVG(
            1 / (
                POW(
                    (vehicle_incidents."Latitude"::float - :lat) * (3.1415 / 180) * 3959,
                    2
                ) + POW(
                    (vehicle_incidents."Longitude"::float - :lon) * (3.1415 / 180) * 3959,
                    2
                )
            )
        ) as "Risk Score"
    FROM
        vehicle_incidents
),
total_count AS (
    SELECT
        SUM("Count") "Count"
    FROM
        sf_risk_scores
),
safer_count AS (
    SELECT
        SUM(sf_risk_scores."Count") "Count"
    FROM
        sf_risk_scores,
        spot_score
    WHERE
        sf_risk_scores."Risk Score" < spot_score."Risk Score"
)
SELECT
    100.0 * safer_count."Count" / total_count."Count" "Percentile",
    spot_score."Risk Score"
FROM
    safer_count, total_count, spot_score
"""

def lambda_handler(event, context):
    if event['httpMethod'] == 'GET':
        f = open('index.html', 'r')
        return {
            'statusCode': 200,
            'body': f.read(),
            'headers': {
                'Content-Type': 'text/html',
            }
        }
    elif event['httpMethod'] == 'POST':
        res = requests.post(
            'https://api.rs2.usw2.rockset.com/v1/orgs/self/queries',
            headers={
                'Content-Type': 'application/json',
                'Authorization': 'ApiKey %s' % ROCKSET_APIKEY
            },
            data=json.dumps({
                'sql': {
                    'query': QUERY_TEXT,
                    'parameters': [
                        {
                            'name': 'lat',
                            'type': 'float',
                            'value': event['queryStringParameters']['lat']
                        },
                        {
                            'name': 'lon',
                            'type': 'float',
                            'value': event['queryStringParameters']['lon']
                        }
                    ]
                }
            })).json()
        return {
            'statusCode': 200,
            'body': json.dumps(res),
            'headers': {
                'Content-Type': 'application/json',
            }
        }
    else:
        return {
            'statusCode': 405,
            'body': 'method not allowed'
        }
For the client-side, we write a script to fetch the browser's location and then call the backend:
function getLocation() {
  document.getElementById("location-button").style.display = "none";
  showMessage("fetching");
  if (navigator.geolocation) {
    navigator.geolocation.getCurrentPosition(handleLocation, function (error) {
      showMessage("denied")
    });
  } else {
    showMessage("unsupported")
  }
}

function handleLocation(position) {
  showMessage("querying");
  var lat = position.coords.latitude;
  var lon = position.coords.longitude;
  fetch(
    'https://aj8wl2pz30.execute-api.us-west-2.amazonaws.com/default/sf-parking?lat=' + lat + '&lon=' + lon,
    { method: 'POST' }
  ).then(function (response) {
    return response.json();
  }).then(function (result) {
    setResult(result['results'][0]);
    showMessage("result");
    document.getElementById("tile").style.justifyContent = "start";
  });
}

function setResult(result) {
  document.getElementById('score').textContent = parseFloat(result['Risk Score']).toFixed(3);
  document.getElementById('percentile').textContent = parseFloat(result['Percentile']).toFixed(3);
  if (result['Percentile'] == 0) {
    document.getElementById('zero').style.display = "block";
  }
}

function showMessage(messageId) {
  var messages = document.getElementsByClassName("message");
  for (var i = 0; i < messages.length; i++) {
    messages[i].style.display = "none";
  }
  document.getElementById(messageId).style.display = "block";
}
To finish it off, we add API Gateway as a trigger for our lambda and drop a Rockset API key into the environment, which can all be done in the AWS Console.
Conclusion
To summarize what we did here:
- We took two fairly straightforward datasets—one for incidents reported by SPFD and one for parking spots reported by SFMTA—and loaded the data into Rockset.
- Several iterations of SQL later, we had an API we could call to fetch a risk score for a given geolocation.
- We wrote some simple code into an AWS Lambda to serve this as a mobile web app.
The only software needed was a web browser (download the data, query in Rockset Console, and deploy in AWS Console), and all told this took less than a day to build, from idea to production. The source code for the lambda is available here.