How to Do Data Science Using SQL on Raw JSON
January 10, 2019
This post outlines how to use SQL for querying and joining raw data sets like nested JSON and CSV - for enabling fast, interactive data science.
Data scientists and analysts deal with complex data. Much of what they analyze could be third-party data, over which there is little control. In order to make use of this data, significant effort is spent in data engineering. Data engineering transforms and normalizes high-cardinality, nested data into relational databases or into an output format that can then be loaded into data science notebooks to derive insights. At many organizations, data scientists or, more commonly, data engineers implement data pipelines to transform their raw data into something usable.
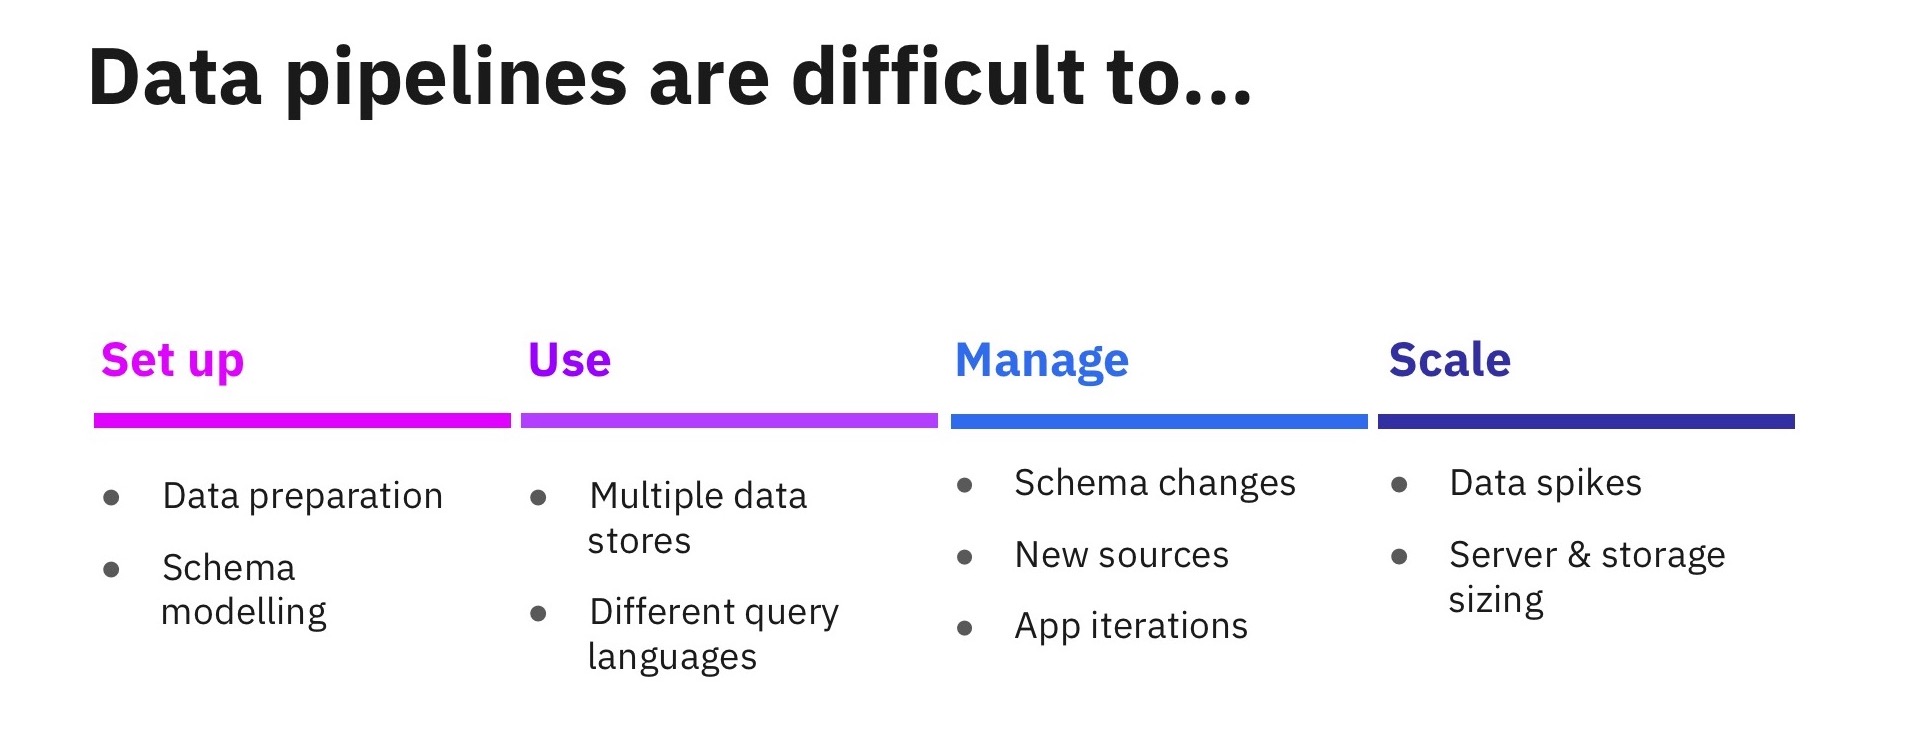
Data pipelines, however, regularly get in the way of data scientists and analysts getting to insights with their data. They are time-consuming to write and maintain, especially as the number of pipelines grows with each new data source added. They are often brittle, don't handle schema changes well, and add complexity to the data science process. Data scientists are typically dependent on others—data engineering teams—to build these pipelines as well, reducing their speed to value with their data.
Analyzing Third-Party Data to Support Investment Decisions
I've had the opportunity to work with a number of data scientists and analysts in investment management firms, who are analyzing complex data sets in order to support investment decisions. They increasingly bring in alternative, third-party data—app usage, website visits, people hired, and fundraising—to enhance their research. And they use this data to evaluate their existing portfolio and source new investment opportunities. The typical pipeline for these data sets includes scripts and Apache Spark jobs to transform data, relational databases like PostgreSQL to store the transformed data, and finally, dashboards that serve information from the relational database.
In this blog, we take a specific example where a data scientist may combine two data sets—an App Annie nested JSON data set that has statistics of mobile app usage and engagement, and Crunchbase CSV data set that tracks public and private companies globally. The CSV data to be queried is stored in AWS S3. We will use SQL to transform the nested JSON and CSV data sets and then join them together to derive some interesting insights in the form of interactive data science, all without any prior preparation or transformation. We will use Rockset for running SQL on the JSON and CSV data sets.
Understanding the shape of the nested JSON data set using Jupyter notebook
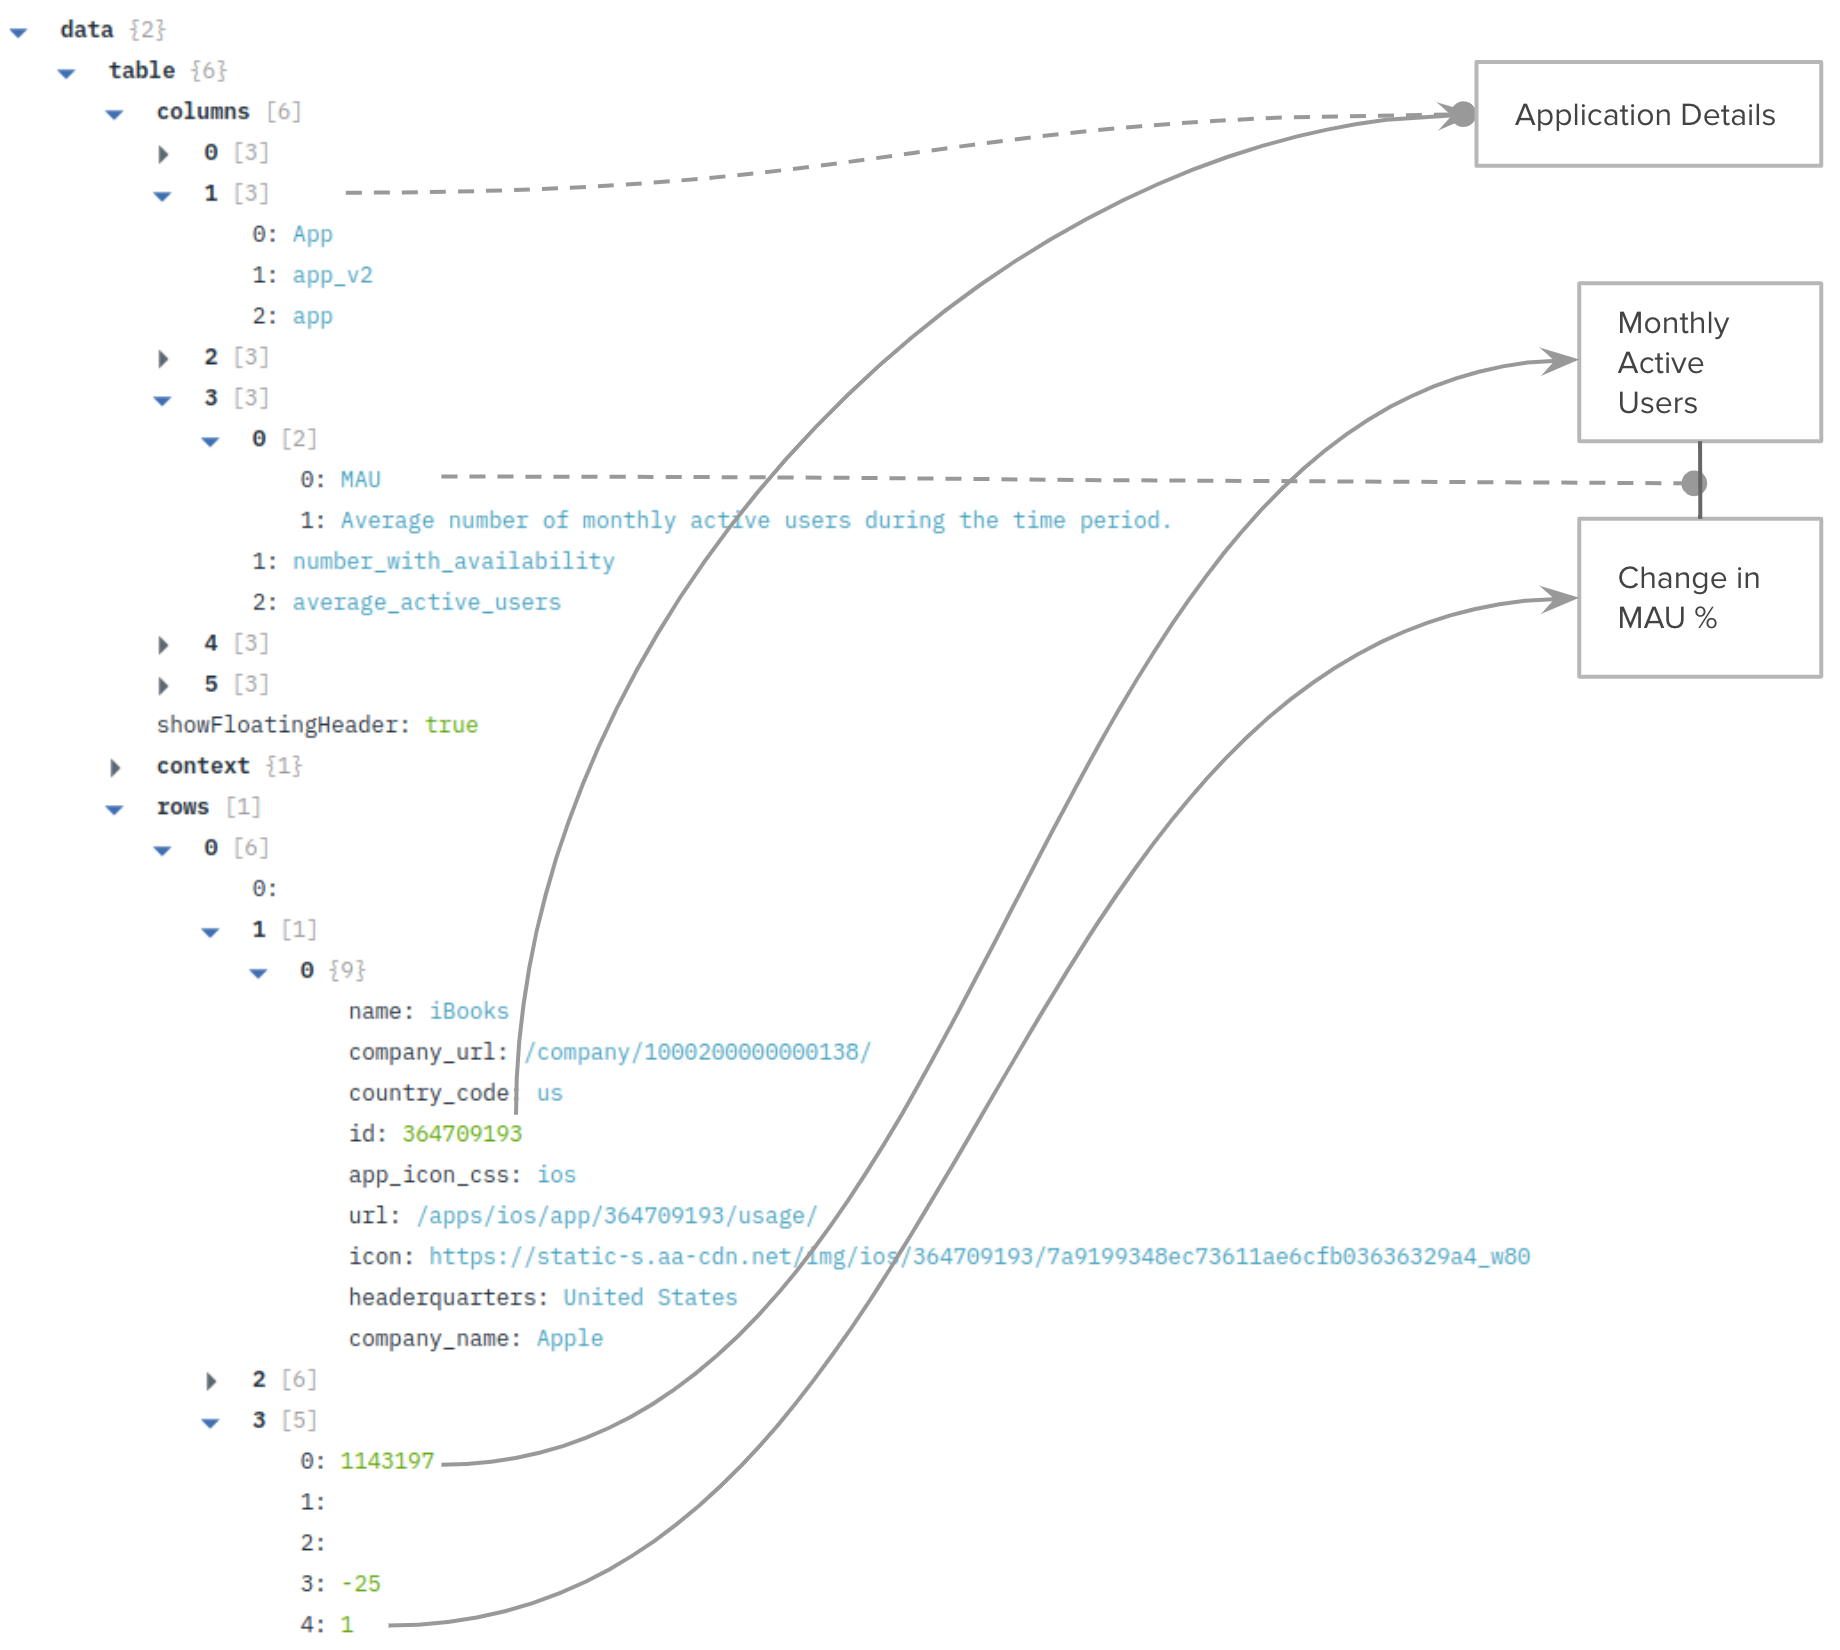
We begin by loading the App Annie dataset into a Rockset collection named app_annie_monthly. App Annie data is in the form of nested JSON, and has up to 3 levels of nested arrays in it. It has descriptions of fields in columns, including statistics of Monthly Active Users (MAU) that we'll be using later. The rows contain the data corresponding to those columns in the description.
Following this, we can set up our Jupyter notebook configured to use our Rockset account. Immediately after setup, we can run some basic SQL queries on the nested JSON data set that we have loaded.
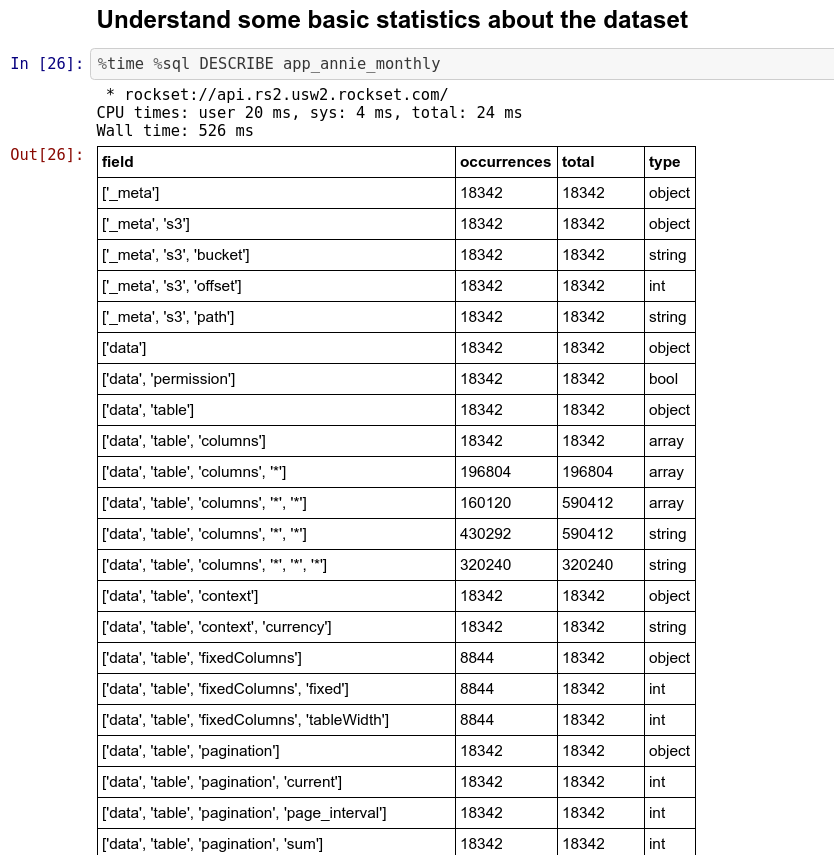
Running SQL on nested JSON data
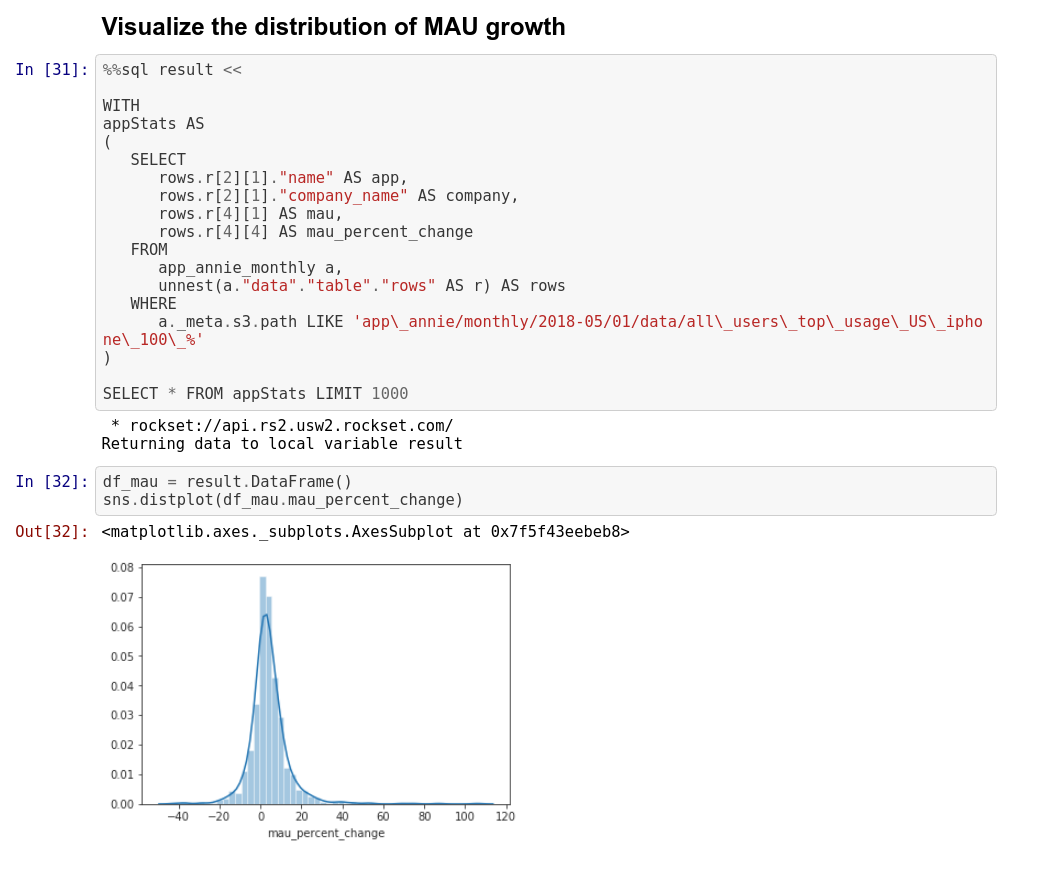
Once we have understood the overall structure of the nested JSON data set, we can start unpacking the parts we're interested in using the UNNEST command in SQL. In our case, we care about the app name, the percentage increase in MAU month over month, and the company that makes the app.
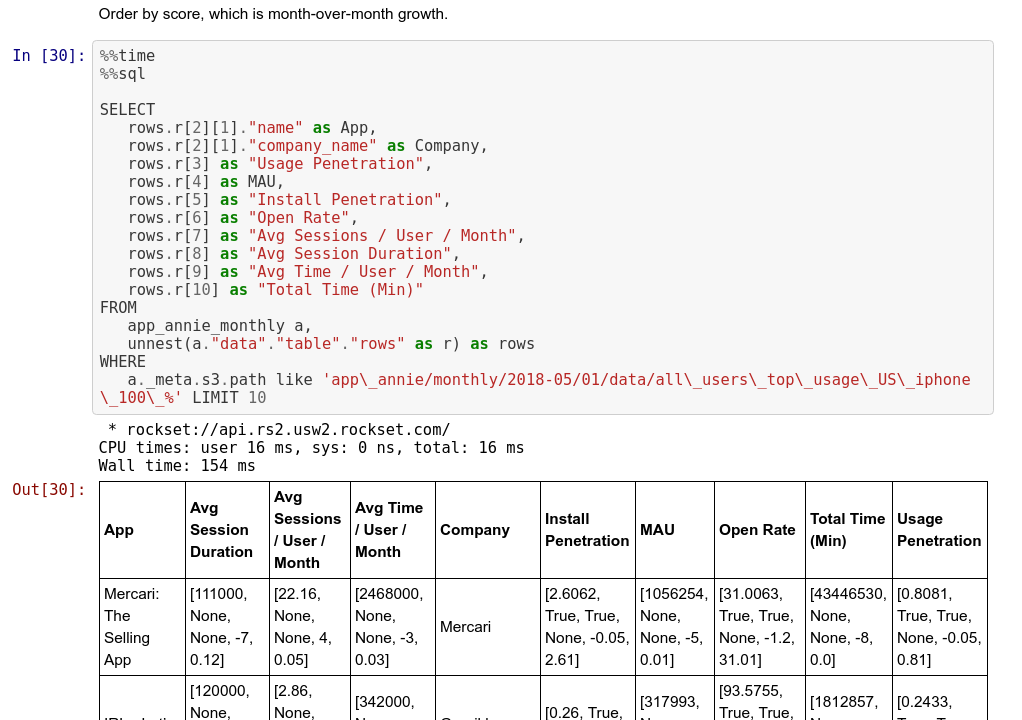
Once we have gotten to this table, we can do some basic statistical calculations by exporting the data to dataframes. Dataframes can be used to visualize the percentage growth in MAU over the data set for a particular month.
Using SQL to join the nested JSON data with CSV data
Now we can create the crunchbase_funding_rounds collection in Rockset from CSV files stored in Amazon S3 so that we can query them using SQL. This is a fairly simple CSV file with many fields. We are particularly interested in some fields: company_name, country_code, investment_type, investor_names, and last_funding. These fields provide us additional information about the companies. We can join these on the company_name field, and apply a few additional filters to arrive at the final list of prospects for investment, ranked from maximum to minimum increase in MAU.
%%time
%%sql

WITH

-- # compute application statistics, MAU and percent change in MAU.
appStats AS
(
   SELECT
      rows.r[2][1]."name" AS app,
      rows.r[2][1]."company_name" AS company,
      rows.r[4][1] AS mau,
      rows.r[4][4] AS mau_percent_change
   FROM
      app_annie_monthly a,
      unnest(a."data"."table"."rows" AS r) AS rows
   WHERE
      a._meta.s3.path LIKE 'app\_annie/monthly/2018-05/01/data/all\_users\_top\_usage\_US\_iphone\_100\_%'
),


-- # Get list of crunchbase orgs to join with.
crunchbaseOrgs AS
(
   SELECT
      founded_on AS founded_on,
      uuid AS company_uuid,
      short_description AS short_description,
      company_name as company_name
   FROM
      "crunchbase_organizations"
),


-- # Get the JOINED relation from the above steps.
appStatsWithCrunchbaseOrgs as
(
   SELECT
      appStats.app as App,
      appStats.mau as mau,
      appStats.mau_percent_change as mau_percent_change,
      crunchbaseOrgs.company_uuid as company_uuid,
      crunchbaseOrgs.company_name as company_name,
      crunchbaseOrgs.founded_on as founded_on,
      crunchbaseOrgs.short_description as short_description
   FROM
      appStats
      INNER JOIN
         crunchbaseOrgs
         ON appStats.company = crunchbaseOrgs.company_name
),

-- # Compute companyStatus = (IPO|ACQUIRED|CLOSED|OPERATING)
-- # There may be more than one status associated with a company, so, we do the Group By and Min.
companyStatus as
(
   SELECT
      company_name,
      min(
      case
         status
     when
        'ipo'
     then
        1
     when
        'acquired'
     then
        2
     when
        'closed'
     then
        3
     when
        'operating'
     then
        4
  end
) as status
   FROM
      "crunchbase_organizations"
   GROUP BY
      company_name
),


-- #  JOIN with companyStatus == (OPERATING), call it ventureFunded
ventureFunded as (SELECT
   appStatsWithCrunchbaseOrgs.App,
   appStatsWithCrunchbaseOrgs.company_name,
   appStatsWithCrunchbaseOrgs.mau_percent_change,
   appStatsWithCrunchbaseOrgs.mau,
   appStatsWithCrunchbaseOrgs.company_uuid,
   appStatsWithCrunchbaseOrgs.founded_on,
   appStatsWithCrunchbaseOrgs.short_description
FROM
   appStatsWithCrunchbaseOrgs
   INNER JOIN
      companyStatus
      ON appStatsWithCrunchbaseOrgs.company_name = companyStatus.company_name
      AND companyStatus.status = 4),

-- # Find the latest round that each company raised, grouped by company UUID
latestRound AS
(
   SELECT
      company_uuid as cuid,
      max(announced_on) as announced_on,
      max(raised_amount_usd) as raised_amount_usd
   FROM
      "crunchbase_funding_rounds"
   GROUP BY
      company_uuid
),


-- # Join it back with crunchbase_funding_rounds to get other details about that company
fundingRounds AS
(
   SELECT
      cfr.company_uuid as company_uuid,
      cfr.announced_on as announced_on,
      cfr.funding_round_uuid as funding_round_uuid,
      cfr.company_name as company_name,
      cfr.investment_type as investment_type,
      cfr.raised_amount_usd as raised_amount_usd,
      cfr.country_code as country_code,
      cfr.state_code as state_code,
      cfr.investor_names as investor_names
   FROM
      "crunchbase_funding_rounds" cfr
  JOIN
     latestRound
     ON latestRound.company_uuid = cfr.company_uuid
     AND latestRound.announced_on = cfr.announced_on
),

-- # Finally, select the dataset with all the fields that are interesting to us. ventureFundedAllRegions
ventureFundedAllRegions AS (
    SELECT
       ventureFunded.App as App,
       ventureFunded.company_name as company_name,
       ventureFunded.mau as mau,
       ventureFunded.mau_percent_change as mau_percent_change,
       ventureFunded.short_description as short_description,
       fundingRounds.announced_on as last_funding,
       fundingRounds.raised_amount_usd as raised_amount_usd,
       fundingRounds.country_code as country_code,
       fundingRounds.state_code as state_code,
       fundingRounds.investor_names as investor_names,
       fundingRounds.investment_type as investment_type
    FROM
       ventureFunded
       JOIN
          fundingRounds
          ON fundingRounds.company_uuid = ventureFunded.company_uuid)

SELECT * FROM ventureFundedAllRegions
ORDER BY
   mau_percent_change DESC LIMIT 10
This final large query does several operations one after another. In order, the operations that it performs and the intermediate SQL query names are:
appStats:UNNESToperation on the App Annie dataset that extracts the interesting fields into a format resembling a flat table.crunchbaseOrgs: Extracts relevant fields from the crunchbase collection.appStatsWithCrunchbaseOrgs: Joins the App Annie and Crunchbase data on the company name.companyStatus: Sets up filtering for companies based on their current status - IPO/Acquired/Closed/Operating. Each company may have multiple records but the ordering ensures that the latest status is captured.ventureFunded: Uses the above metric to filter out organizations that are not currently privately held and operating.latestRound: Finds the latest funding round—in total sum invested (USD) and the date when it was announced.fundingRounds&ventureFundedAllRegions: Wrap it all together and extract other details of relevance that we can use.
Data Science Insights on Prospective Investments
We can run one final query on the named query we have, ventureFundedAllRegions to generate the best prospective investments for the investment management firm.
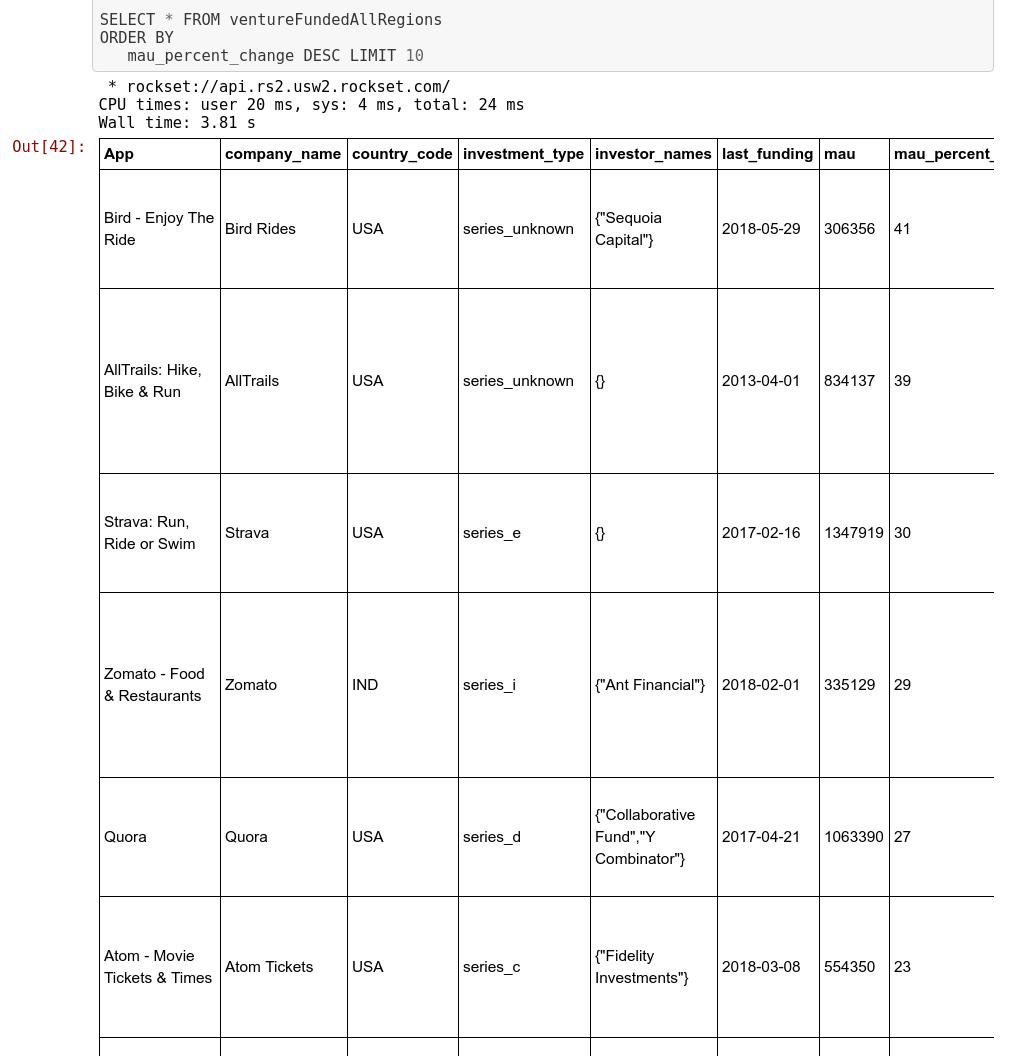
As we see above, we get data that can help with decision making from an investment perspective. We started with applications that have posted significant growth in active users month over month. Then we performed some filtering to impose some constraints to improve the relevance of our list. Then we also extracted other details about the companies that created those applications and came up with a final list of prospects above. In this entire process, we did not make use of any ETL processes that transform the data from one format to another or wrangle it. The last query which was the longest took less than 4 seconds to run, due to Rockset's indexing of all fields and using those indexes to speed up the individual queries.