Production Visibility: Metrics Monitoring and Alerting
June 29, 2021

Pulling back the curtain
One thing that makes Rockset so magical is the fact that it “just works”. After years of carefully provisioning, managing, and tuning their data systems, customers feel that Rockset’s serverless offering is too good to be true (we’ve heard this exact phrase from many customers!). We pride ourselves on having abstracted away the Rube Goldberg-like complexities inherent in maintaining indexes and ETL pipelines. Providing visibility into this complexity is a necessary step to help our users get the most out of our product.
As our users increasingly rely on Rockset to power their applications, the same questions arise:
- How do I know when I need to upgrade to a larger Virtual Instance?
- Can I integrate Rockset into my monitoring and alerting toolkit?
- How can I measure my data and query latencies?
To help answer these questions, we set out to show our users everything they could possibly want to see, avoiding the overly complicated.
We wanted to provide a 360 degree overview for both users in the more exploratory, building phase, as well as those ready to take Rockset into production. With this in mind, we built two new features:
- Monitoring and metrics directly built into the Rockset Console
- The means to integrate with existing third-party monitoring services

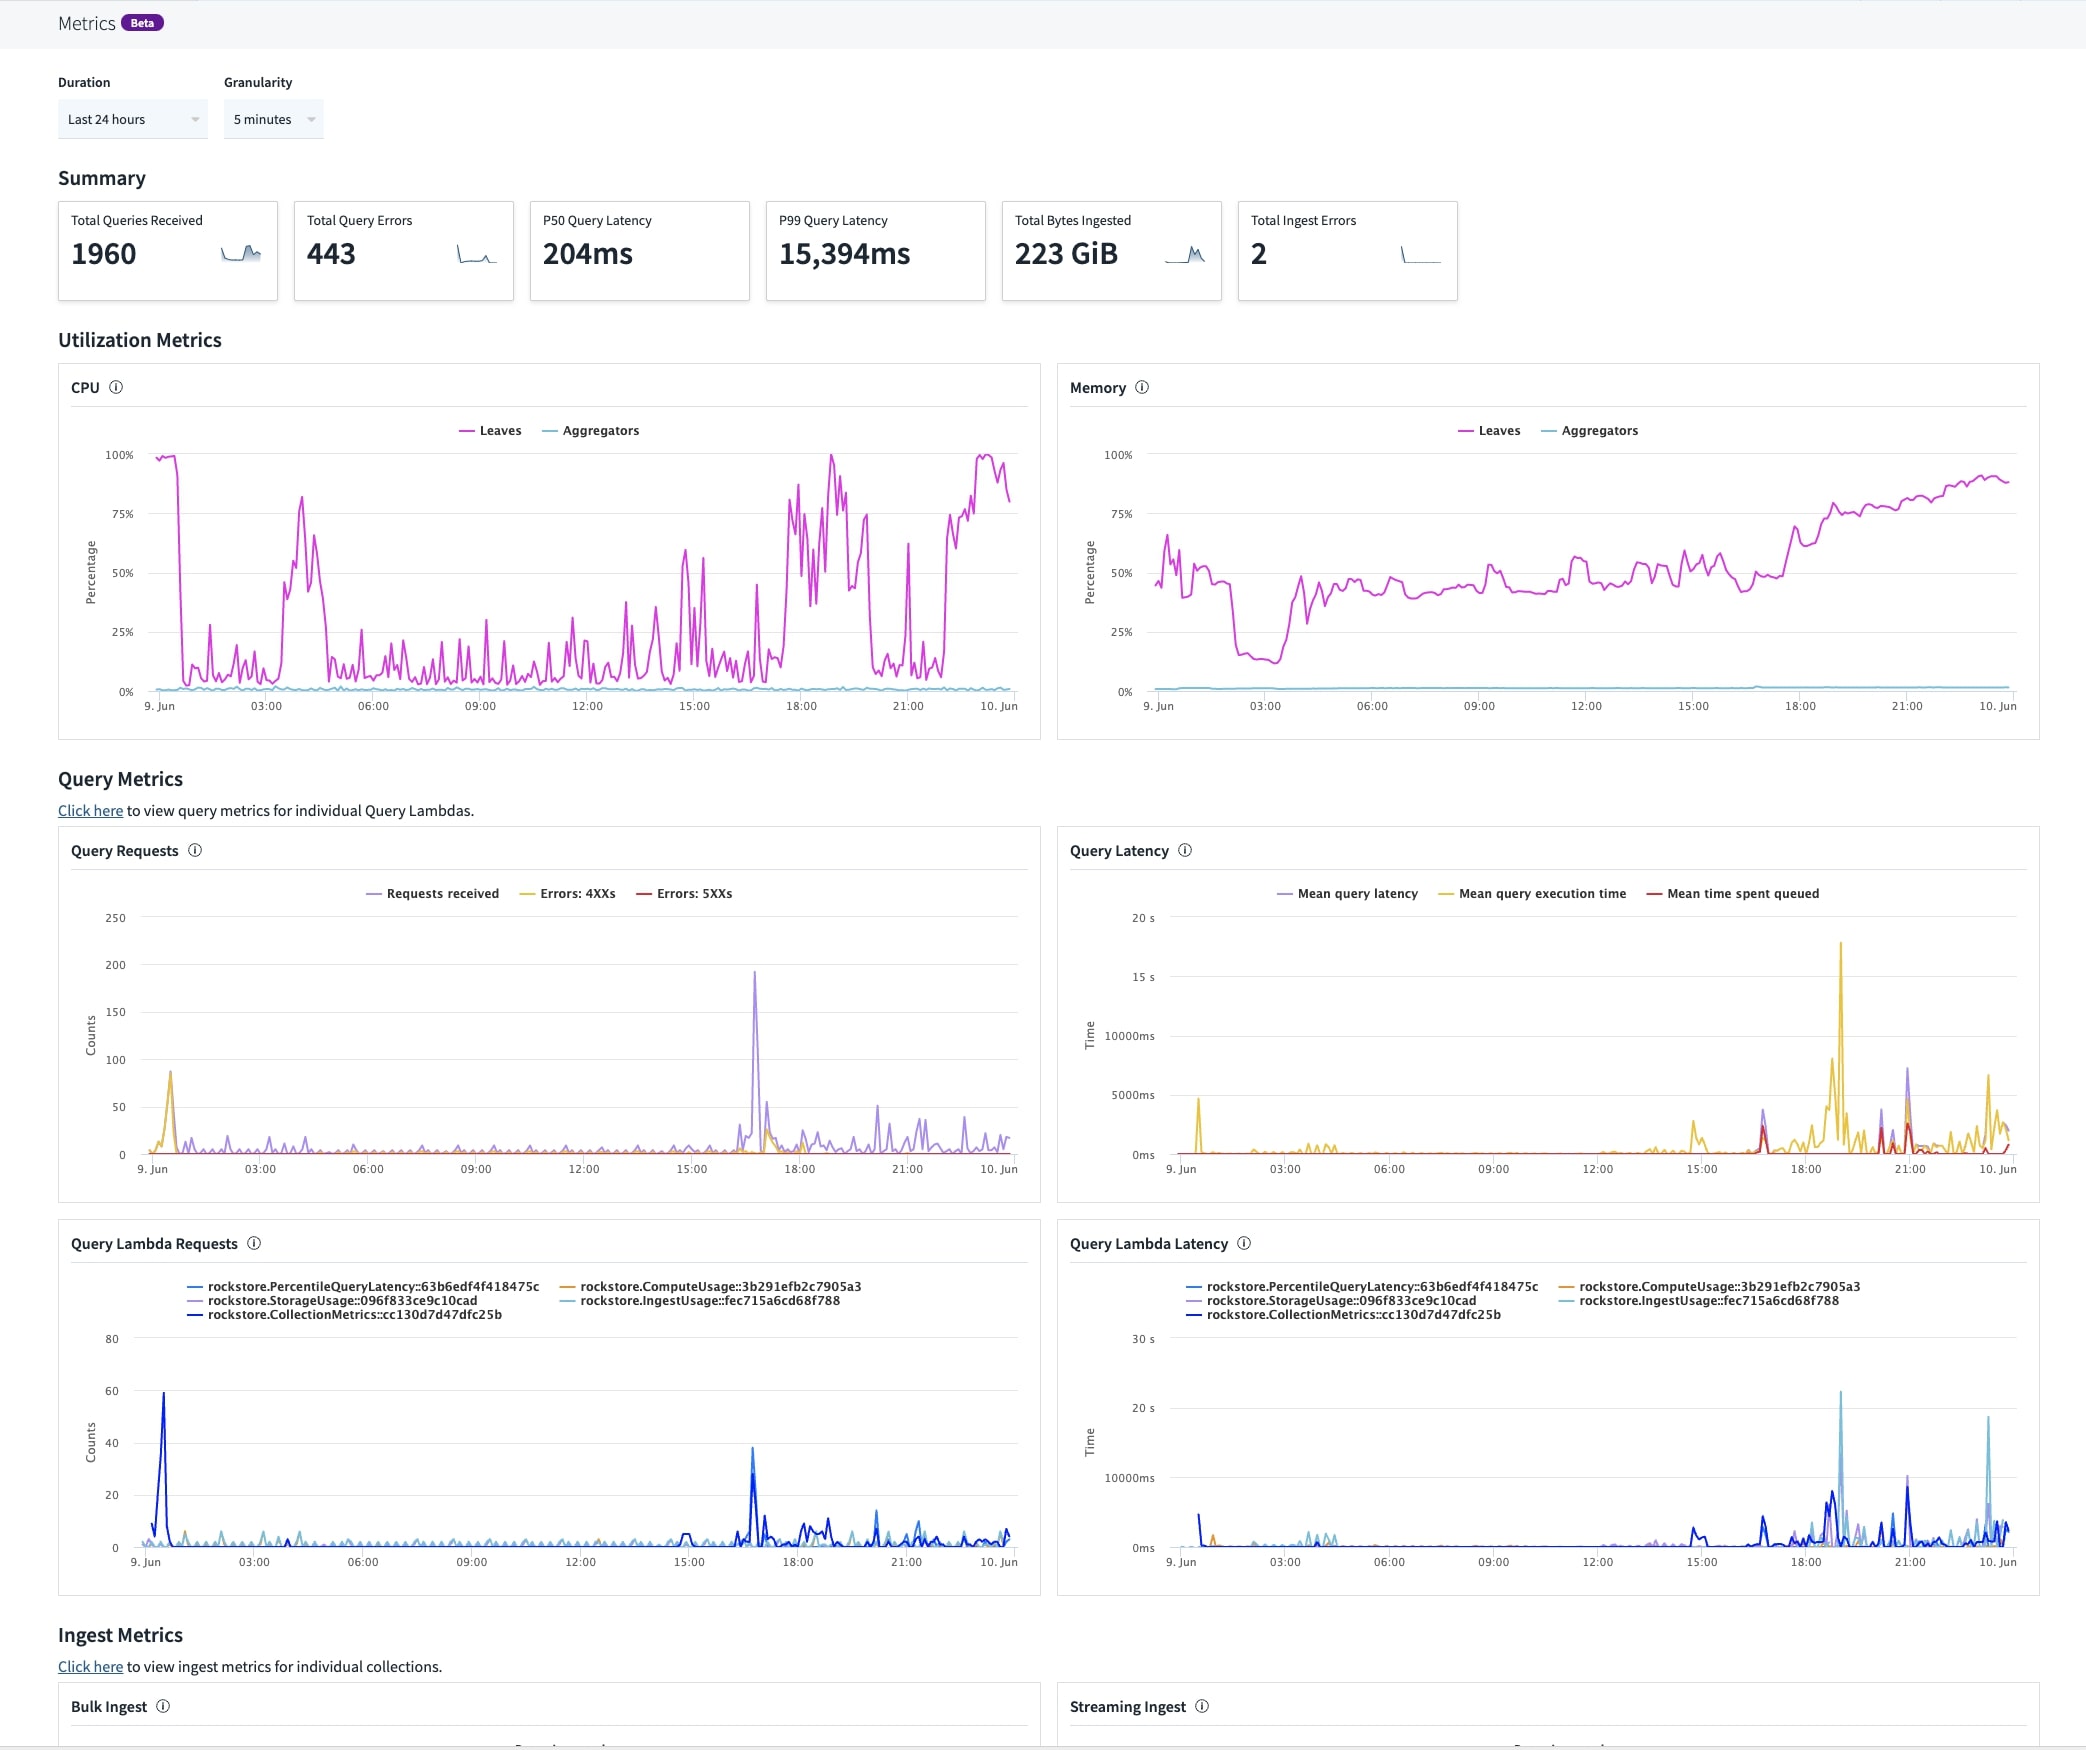
Bringing our users real-time metrics on the health of their Rockset resources felt like the perfect opportunity for dogfooding, and so dogfood we did. Our new Metrics Dashboard is completely powered by Rockset!
Choosing metrics
At a high level, integrating Rockset into your application consists of:
- Choosing a Virtual Instance
- Ingesting data into collections
- Querying your data
The metrics we provide mirror this flow, and holistically cover any complications you may come across when building with Rockset. They fall into four categories:
-
Virtual Instance
- CPU utilization (by leaf / aggregator)
- Allocated compute (by leaf / aggregator)
- Memory utilization (by leaf / aggregator)
- Allocated memory (by leaf / aggregator)
-
Query
- Count (total count, and by Query Lambda)
- Latency (latency across all queries, and by Query Lambda)
- 4XX, and 5XX errors (total count)
-
Ingest
- Replication lag (by collection)
- Ingest errors (total across all collections)
- Streaming ingest (total across all collections)
- Bulk ingest (total across all collections)
-
Storage
- Total storage size (total across all collections, and by collection)
- Total document count (total across all collections, and by collection)
In choosing what metrics to show, our baseline goal was to help users answer the most recurring questions, such as:
-
How can I measure my query latencies? What latencies have my Query Lambda’s been seeing? Have there been any query errors? Why did my query latency spike?
- Query latencies and errors across all queries are available, as well as latencies and errors per Query Lambda in Query Lambda details.
- If your query latency spiked in the last 24 hours, you can drill down by looking at query latency by Query Lambda if applicable.
-
What's the data latency between my external source and my Rockset collection? Have there been any parse errors?
- You can now view replication lag, as well as ingest parse errors per collection in collection details.
-
How do I know when I need to upgrade to a larger Virtual Instance?
- If you see spikes in CPU or memory utilization for your Virtual Instance, you should probably stagger your query load, or upgrade to a larger Virtual Instance. Check your query count / latency for the corresponding timestamp for further confirmation.
Check out the new dashboard in the Metrics tab of the Rockset Console!
Integrating with existing monitoring services
Once you’ve done your due diligence and have decided that Rockset is the right fit for your application needs, you’ll likely want to integrate Rockset into your existing monitoring and alerting workflows.
Every team has unique monitoring and alerting needs, and employs a vast array of third-party tools and frameworks. Instead of reinventing the wheel and trying to build our own framework, we wanted to build a mechanism that would enable users to integrate Rockset into any existing tool on the market.
Metrics Endpoint
We expose metrics data in a Prometheus scraping compatible format, already an open standard, enabling you to integrate with many of the most popular monitoring services, including but not limited to:
- Prometheus (and Alertmanager)
- Grafana
- Graphite
- Datadog
- AppDynamics
- Dynatrace
- New Relic
- Amazon CloudWatch
- ...and many more
$ curl https://api.rs2.usw2.rockset.com/v1/orgs/self/metrics -u {API key}:
# HELP rockset_collections Number of collections.
# TYPE rockset_collections gauge
rockset_collections{virtual_instance_id="30",workspace_name="commons",} 20.0
rockset_collections{virtual_instance_id="30",workspace_name="myWorkspace",} 2.0
rockset_collections{virtual_instance_id="30",workspace_name="myOtherWorkspace",} 1.0
# HELP rockset_collection_size_bytes Collection size in bytes.
# TYPE rockset_collection_size_bytes gauge
rockset_collection_size_bytes{virtual_instance_id="30",workspace_name="commons",collection_name="_events",} 3.74311622E8
...
With this endpoint and the tools it integrates with, you can:
- Programmatically monitor the state of your Rockset production metrics
- Configure action items, like alerts based on CPU utilization thresholds
- Set up auto remediation by changing Virtual Instance sizes based on production loads
This endpoint is disabled by default, and can be switched on in the Metrics tab (https://console.rockset.com/metrics) in the Rockset Console.

At Rockset, Grafana and Prometheus are two of our essential monitoring pillars. For the rollout of our visibility efforts, we set up our internal Prometheus scraper to hit our own metrics endpoint. From there, we created charts and alerts which we use in tandem with existing metrics and alerts to monitor the new feature!
Get started
A detailed breakdown of the metrics we export through our new endpoint is available in our documentation.
We have a basic Prometheus configuration file and an Alertmanager rules template in our community Github repository to help you get started.