Using Query Logs in Rockset
December 14, 2023
At Rockset, we continually look for ways to give our customers better visibility into the product. Toward this goal, we recently decided to improve our customer-facing query logging. Our previous iteration of query logs was based in one of our shared services called apiserver. As part of the work that apiserver would do when completing a query execution request, it would create a log that would eventually be ingested into the _events collection. However, there were issues that made us rethink this implementation of query logs:
- No isolation: because the query logs in
_eventsrelied on shared services, heavy traffic from one org could have an impact on query logging in other orgs. - Incomplete logs: because of the issues caused by using shared services, we only logged query errors – successful queries would not be logged. Furthermore, it was not possible for us to log data about async queries.
- No ability to debug query performance – the query logs in
_eventsonly contained basic information about each query. There was no way for the user to get information about why a given query may have run slowly or exhausted compaute resources since the logs contained no information about the query plan.
Improved Query Logging
The new query logs feature addresses all of these issues. The mechanisms that handle query logs are contained entirely within your Virtual Instance as opposed to being within one of Rockset’s shared services. This gives query logs the advantage of isolation. Furthermore, every query you submit will be automatically logged if you have already created a collection with a query logs source (provided you don’t hit a rate limit).
How Query Logs Work
Query logging begins at the end of query execution. As part of the steps that are run in the final aggregator when a query has completed, a record containing metadata associated with your query is created. At this point, we may also have to collect information from other aggregators that were involved in the query. After this is done, the record is temporarily stored in an in-memory buffer. The contents of this buffer are flushed to S3 every few seconds. Once query logs have been dumped to S3, they will be ingested into any of your query log collections that have been created.

INFO vs DEBUG Logs
When we first designed this project, we had always intended for it to work with the query profiler in the console. This would allow our customers to debug query bottlenecks with these logs. However, the query profiler requires quite a bit of data, meaning it would be impossible for every query log to contain all the information necessary for the profiler. To solve this problem, we opted to create two tiers of query logs – INFO and DEBUG logs.
INFO logs are automatically created for every query issued by your org. They contain some basic metadata associated with your query but cannot be used with the query profiler. When you know that you may want to have the ability to debug a certain query with the profiler, you can specify a DEBUG log threshold with your query request. If the query execution time is larger than the specified threshold, Rockset will create both an INFO and a DEBUG log. There are two ways of specifying a threshold:
-
Use the
debug_log_threshold_msquery hintSELECT * FROM _events HINT(debug_log_threshold_ms=1000) - Use the
debug_threshold_msparameter in API requests. This is available for both query and query lambda execution requests.
Note that since DEBUG logs are much larger than INFO logs, the rate limit for DEBUG logs is much lower. For this reason, it is recommended that you only provide a DEBUG log threshold when you know that this information could be useful. Otherwise, you run the risk of hitting the rate limit when you most need a DEBUG log.
System Sources
As part of this project, we decided to introduce a new concept called system sources. These are sources which ingest data originating from Rockset. However, unlike the _events collection, collections with system sources are managed entirely by your organization. This allows you to configure all of the settings of these collections. We will be introducing more system source types as time goes on.
Getting Started with Query Logging
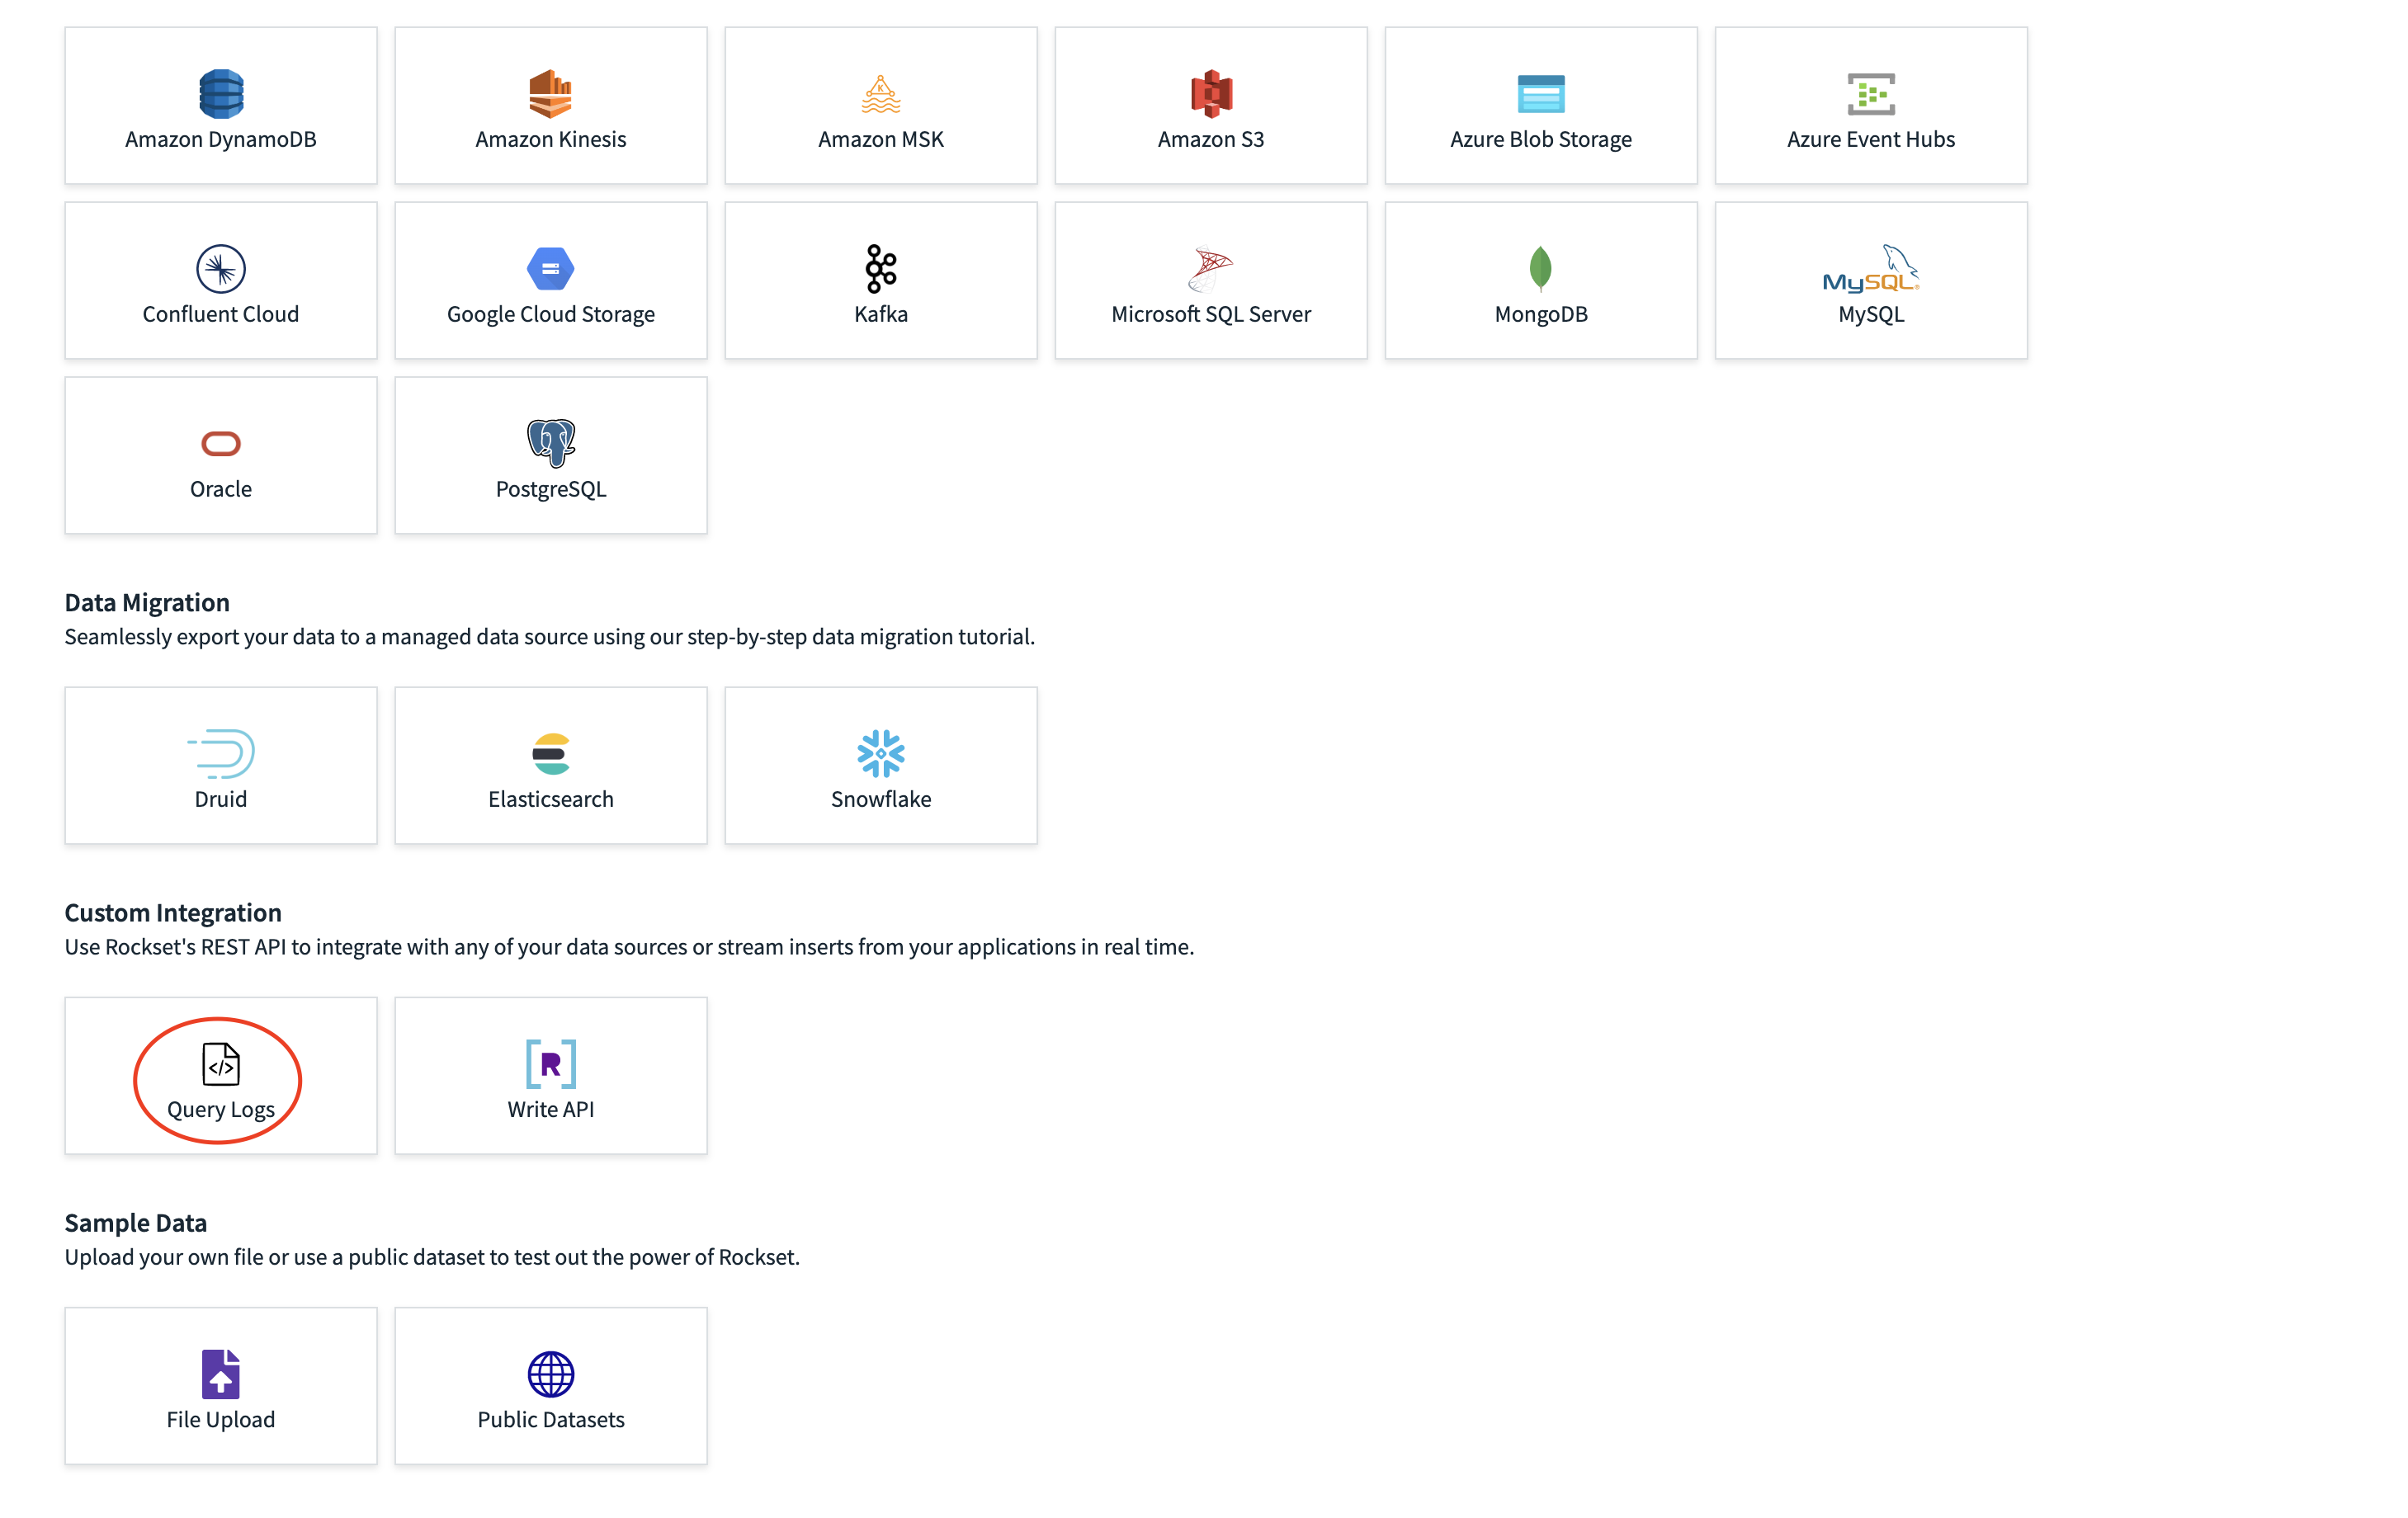
In order to start logging your queries, all you need to do is create a collection with a query logs source. This can be done through the console.

Rockset will begin ingesting query logs into this collection as you submit queries. Logs for the last 24 hours of queries will also be ingested into this collection. Please note that it can take a few minutes after a query has completed before the associated log will show up in your collection.
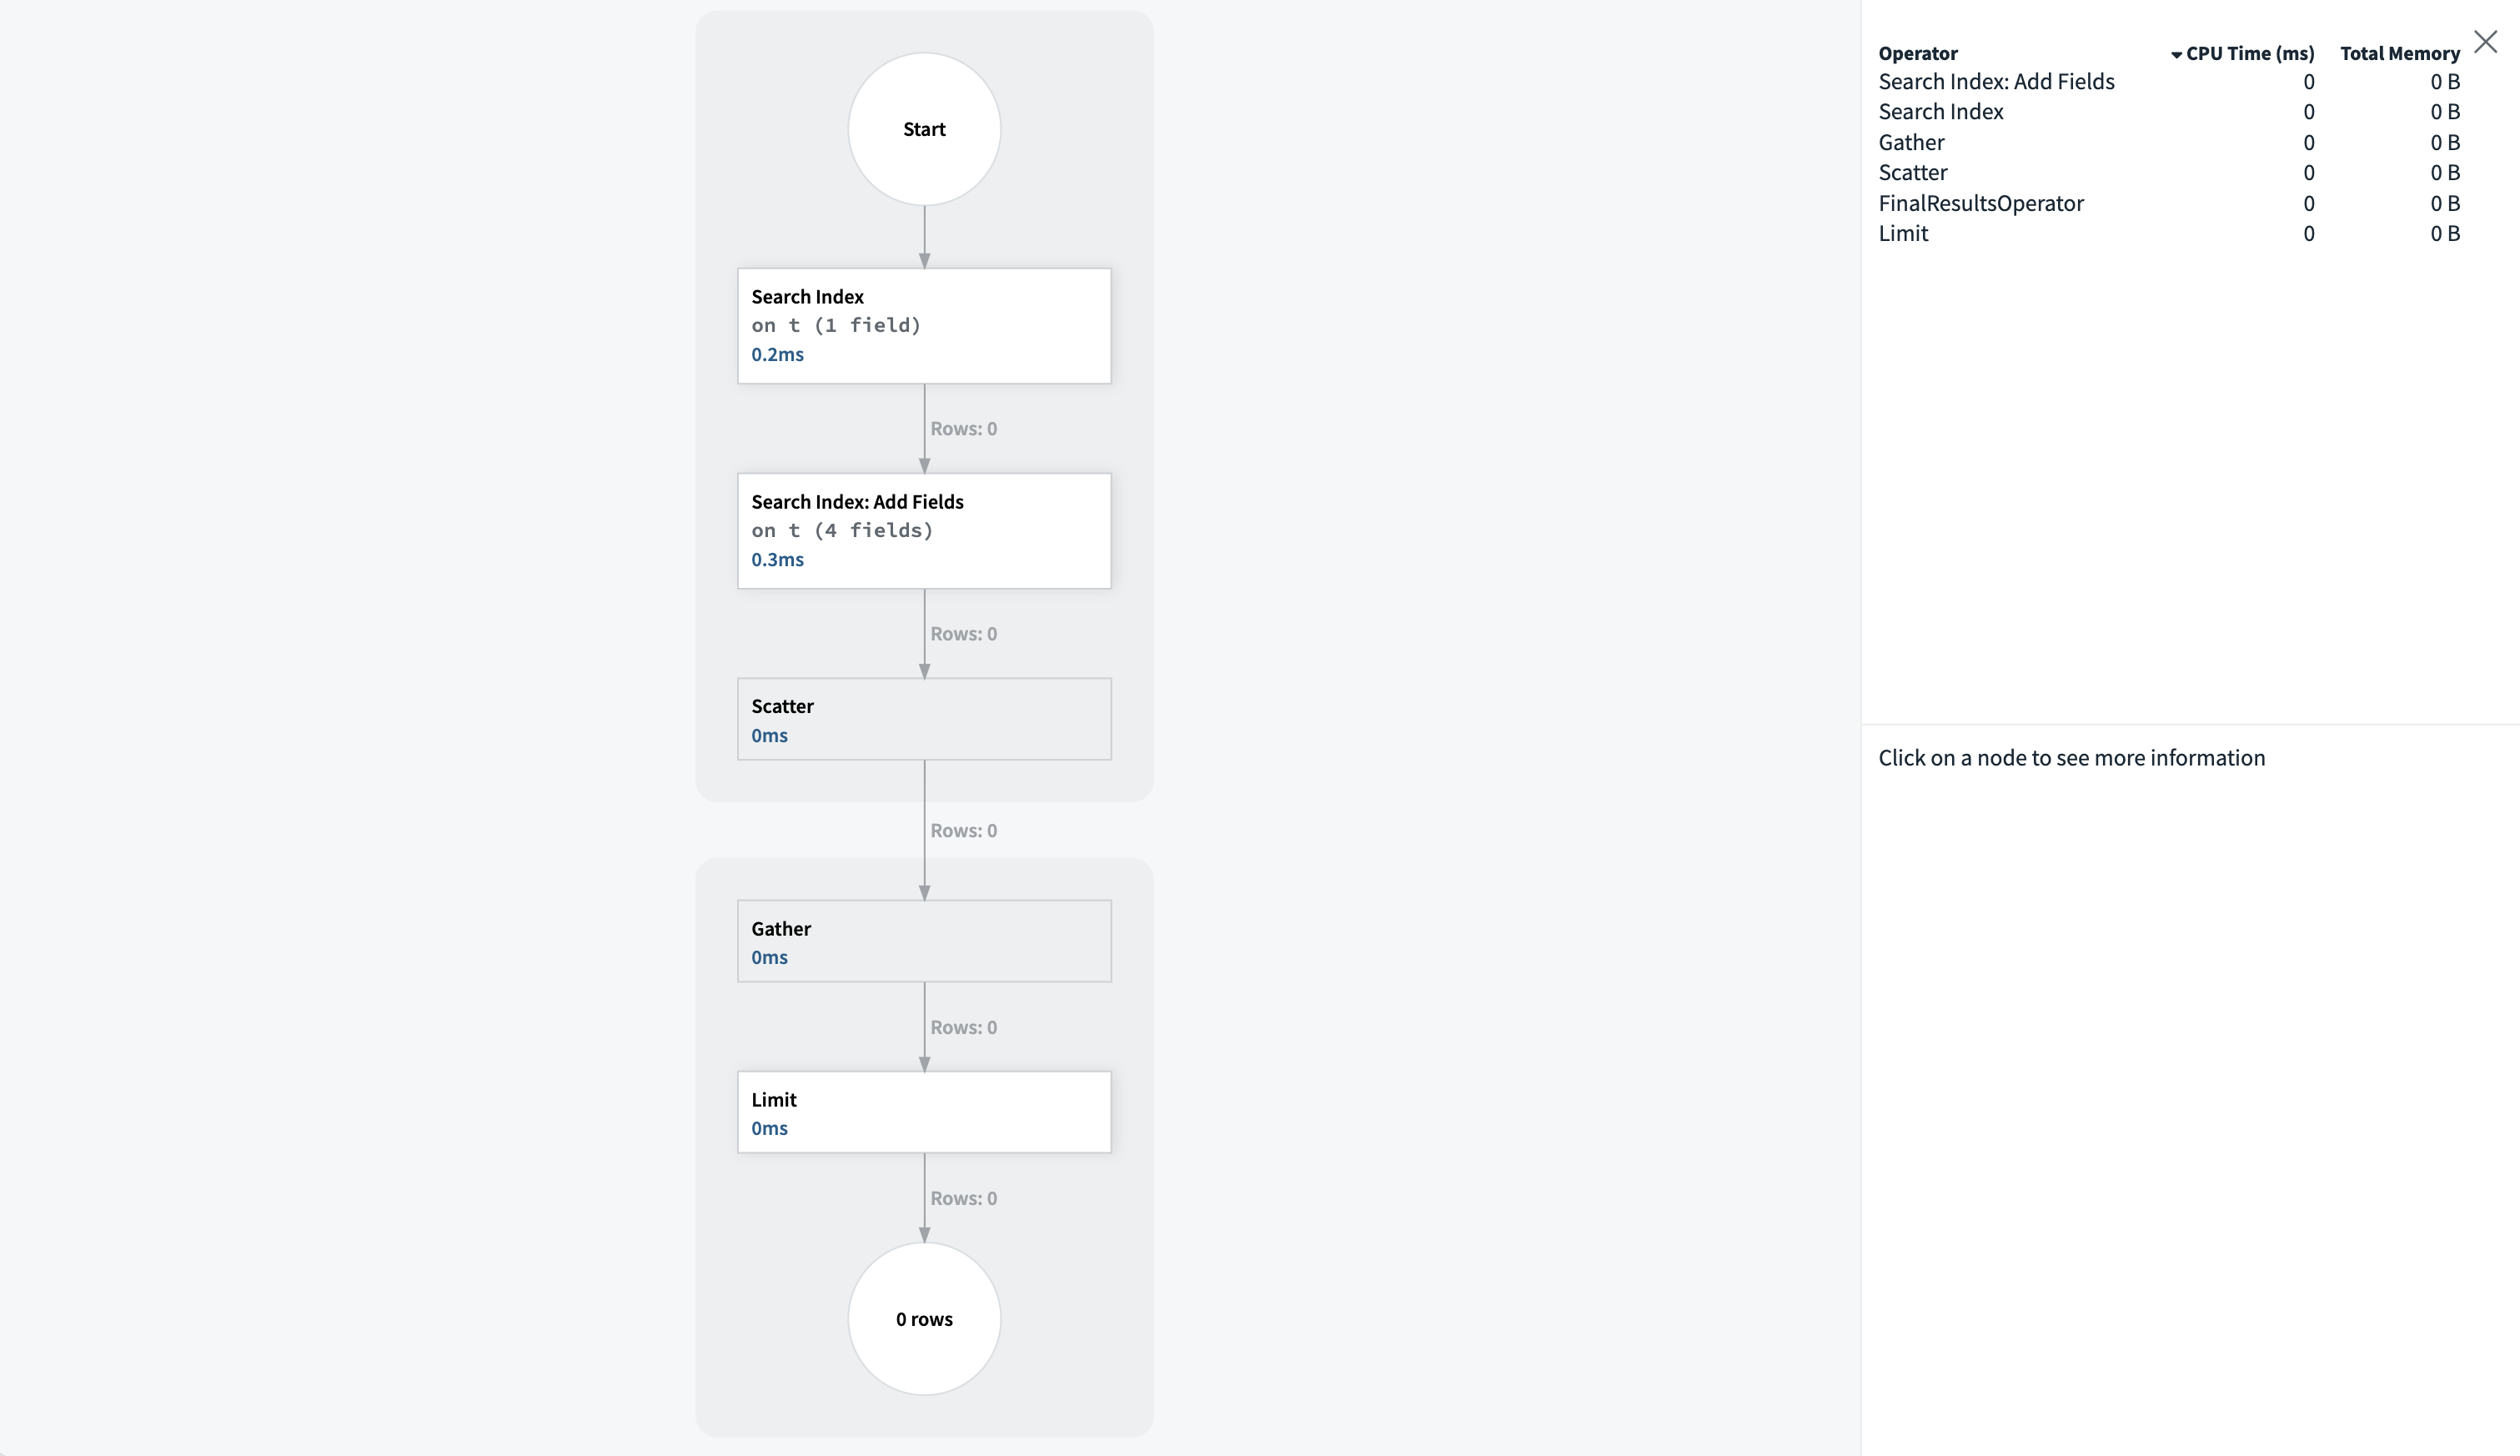
In order to use the query profiler with these logs, open the Rockset Console’s query editor and issue a query that targets one of your query logs collections. The query editor will detect that you are attempting to query a collection with a query logs source and a column called 'Profiler' will be added to the query results table. Any documents that have a populated stats field will have a link in this column. Clicking on this link will open the query profile in a new tab.


Note that custom ingest transformations or query aliases can interfere with this functionality so it is recommended that you do not rename any columns.
For an extensive dive into using Rockset’s Query Profiler, please refer to the video available here.
Conclusion
Hopefully, this has given you a quick look into the functionality that query logs can offer. Whether you need to debug query performance or check why previously completed queries have failed, your experience with Rockset will be improved by making use of query logs.