Visualize NoSQL Data in Tableau Dashboards

Without a single line of code

Access the Full Data Story

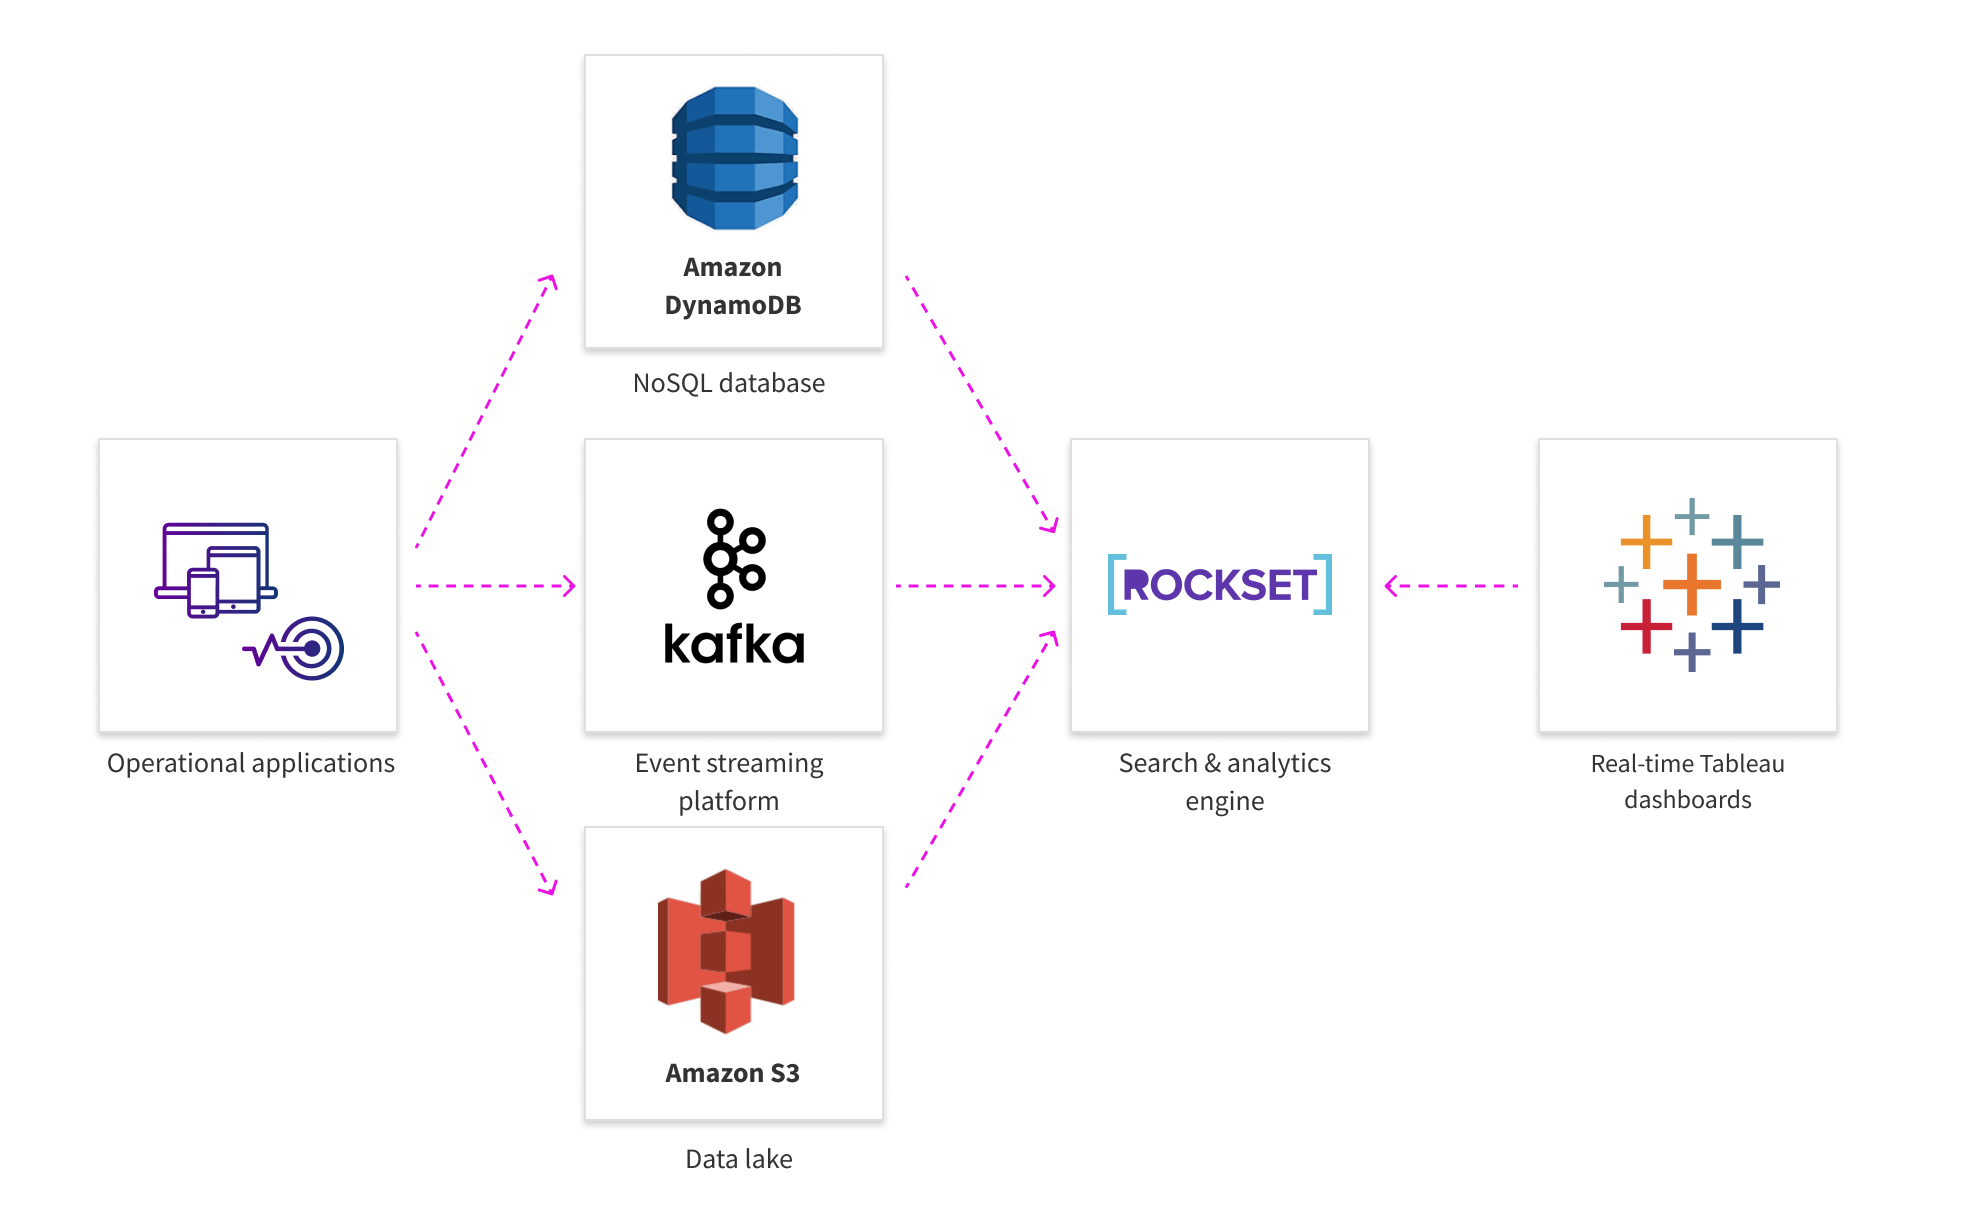
Tableau users can visualize data from modern sources like Apache Kafka, Amazon DynamoDB, and Amazon S3 in real time- without writing a single line of code- for operational monitoring and analytics.

Use Cases
DynamoDB
The burden of server management saps time and energy that could be spent analyzing business data. Rockset is an operational analytics engine that is entirely serverless, it does not require provisioning, capacity planning or server administration in the cloud. Developers and data engineers can run complex queries with the full power of SQL and, using Rockset’s JDBC connector, enable visualizations that include NoSQL data from DynamoDB in Tableau dashboards in real time.
Kafka
Kafka does not have a direct connection to Tableau, limiting the ability of data teams to make decisions on real-time streaming data. Rockset complements Kafka’s KSQL stream processing capabilities by serving as the “sink” that ingests the processed stream. With Rockset, streaming event data from Kafka is automatically represented as a dynamic SQL table and available for querying in seconds. Using Rockset’s JDBC connector, business teams are able to visualize real-time event streams that include NoSQL data in Tableau.
S3
Accessing S3 data in Tableau used to require hours or weeks of data cleaning, migration to a data warehouse, and custom pipelines. The onerous data engineering effort left large swaths of data inaccessible to analysts making business decisions. With Rockset, you can run fast SQL analytics on data collected in your data lake without requiring upfront schema definition or ETL. As new data lands in your data lake, it becomes queryable in seconds in Rockset.

How It Works

Rockset helps you make instant decisions from reams of real-time data by continuously collecting data, running and search and analytics without predefined schemas and ETL, and powering dashboards.

Operational Monitoring and Analytics

Rockset is designed for highly concurrent, low latency queries so that business teams can access real-time data for real-time insights.

Continuously load data
Use one of Rockset's native integrations with DynamoDB, Amazon S3, Google Cloud Storage, Amazon Redshift, Kinesis, Apache Kafka and more to securely load your data. Stay in sync with your source without building custom pipelines.
Explore unstructured data as SQL tables
Your nested JSON, XML, CSV or Parquet dataset is converted into a SQL table without requiring a schema ahead of time. Rockset distributes, replicates and indexes your dataset so you can run millisecond-latency SQL (including JOINs) over TBs of data.
Deliver real-time dashboards
Query Rockset from an interactive Tableau dashboard. Rockset auto-scales storage and compute, so you get reliable performance without having to manage servers or databases.

Visualization Tools

Enable your business teams to visualize real-time event streams using dashboarding tools that they already know and love, using Rockset's JDBC connector and native support for standard SQL-based visualization tools.

Tab for Grafana
Tab for Redash
Tab for Superset
Tab for Tableau

Grafana

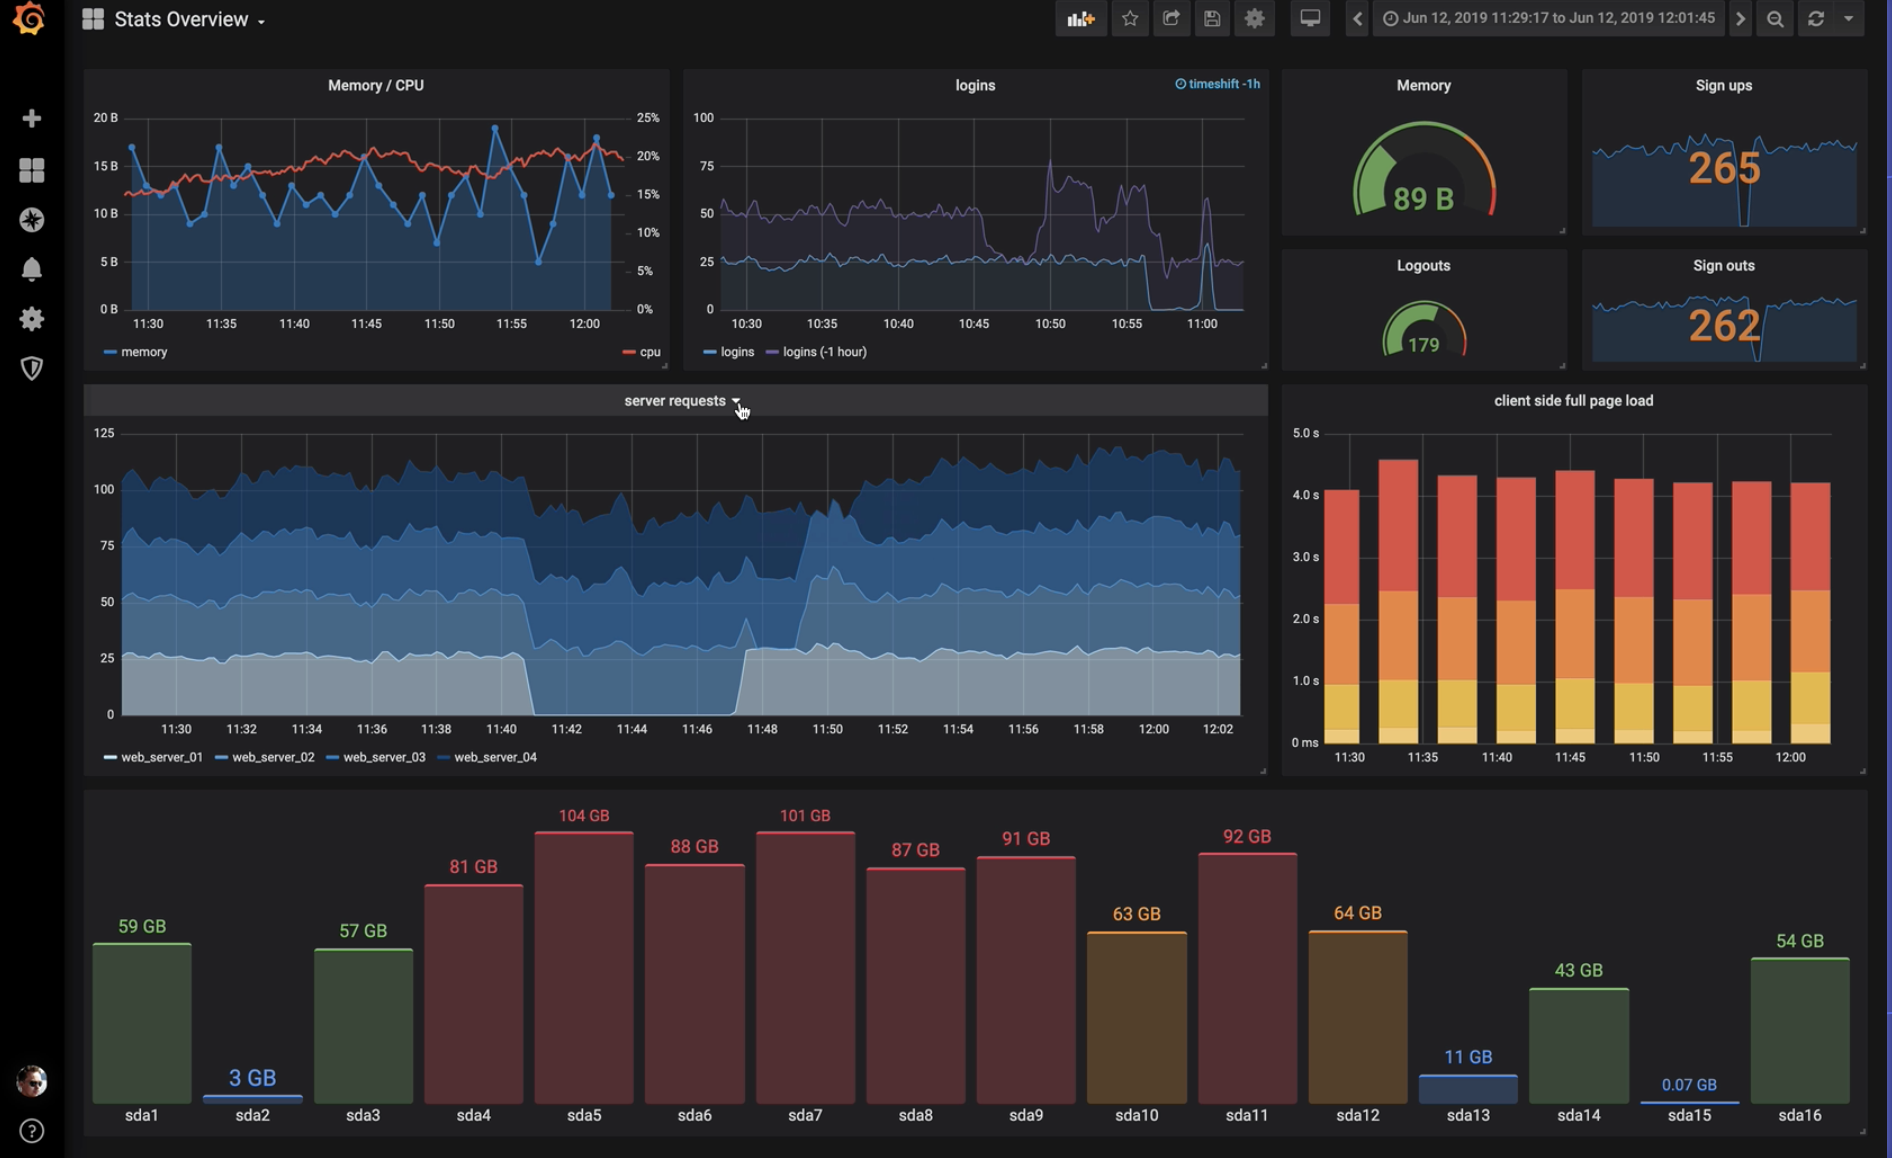
Grafana is an open observability platform for analytics and monitoring. Grafana requires a SQL backend and cannot query Kafka directly. Use Rockset to visualize Kafka events in Grafana.

Learn more

Resources


How-To GuideHow-To Guide

Using Tableau with Kafka to Explore Trending Reddit Comments

Build a real-time Tableau dashboard for operational monitoring and analytics on streaming event data from Kafka.

Read more->
How-To GuideHow-To Guide

Visualize Rental Marketplace Data from DynamoDB

We create an example dashboard in Tableau on data in DynamoDB, using Rockset as the SQL intelligence layer.

Read more->
How-To GuideHow-To Guide

Create a Live Dashboard for Event Data

In a few steps, we walk through how to ingest a stream of complex JSON event data, connect Tableau to the data in Rockset, and add charts to a live dashboard.

Read more->
Related BlogRelated Blog

Evaluate Analytics Services for Operational Dashboards

We review several approaches to building operational dashboards on DynamoDB data, using SQL engines like Redshift and Athena.

Read more->
DocumentationDocumentation

How to Connect Rockset and Tableau

Read up on how to setup Tableau Desktop and configure it for use with Rockset.

Read more->
How-To GuideHow-To Guide

FULL Uses Rockset for Live Dashboards

FULL Creative uses Rockset to build live dashboards and run complex SQL on contact center call data in DynamoDB.

Read more->

Our Customers

See how the most innovative companies do more with their data, faster.

<-

"Building our dashboard on Rockset was the easiest way to analyze our call data in DynamoDB and get real-time insights on the metrics we care about."

-Naresh Talluri, product manager at FULL Creative

Read more->
->

Try Tableau on NoSQL now

mouse pointer

Sign up for free

Get started with $300 in free credits. No credit card required.