3 Tools to Help Debug Slow Queries in MongoDB
October 8, 2020
Regardless of what database you pick to run your application—MongoDB, Postgres, Oracle, or Cassandra—you will eventually encounter the same issue: slow queries.
Slow queries can be the result of inefficient query design, inefficient table design, or general infrastructure problems. Although it may be tempting to add more machines or further complicate your data infrastructure to speed up your queries, improving the queries themselves is usually the best place to start when you want to improve database performance.
MongoDB Atlas is not immune to poor query performance. Luckily, this database comes with several tools that were developed to address this common problem. These tools include Performance Advisor, the Real Time Performance Panel, and Query Profiler—all of which provide developers with different perspectives on and solutions to database performance issues.
This article will explore all three of these tools and discuss how they can improve your MongoDB instance’s performance.
Performance Advisor

Purpose
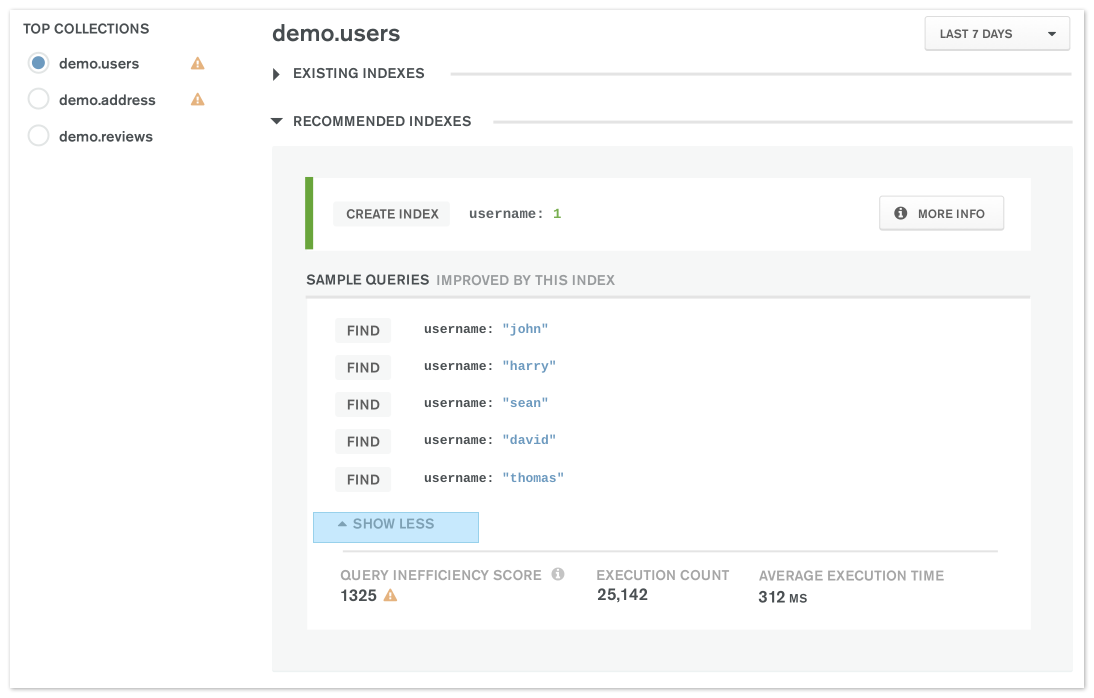
Performance Advisor is a query monitor. It monitors queries on your MongoDB Atlas cluster and suggests new indexes for slow queries. In particular, it highlights queries that take longer than 100 milliseconds to run and offers alternate indexes based on the collections accessed by the query. This feature doesn’t impact the performance of your MongoDB instance while it runs.
In addition, MongoDB Performance Advisor provides impact scores to assist you in better understanding the performance of your database. These scores tell you how many queries per hour will be impacted by your new index, the average current runtime of queries that are running slowly, and the average number of documents read for every document returned by matching queries.
Limitations
This is a post hoc tool. It is meant to flag slowly running queries over time. It is not meant to monitor a currently long-running query and won’t be able to assist you in identifying slow queries in real time.
This is where the Real-Time Performance Panel can come in handy.
Real-Time Performance Panel (RTPP)

Purpose
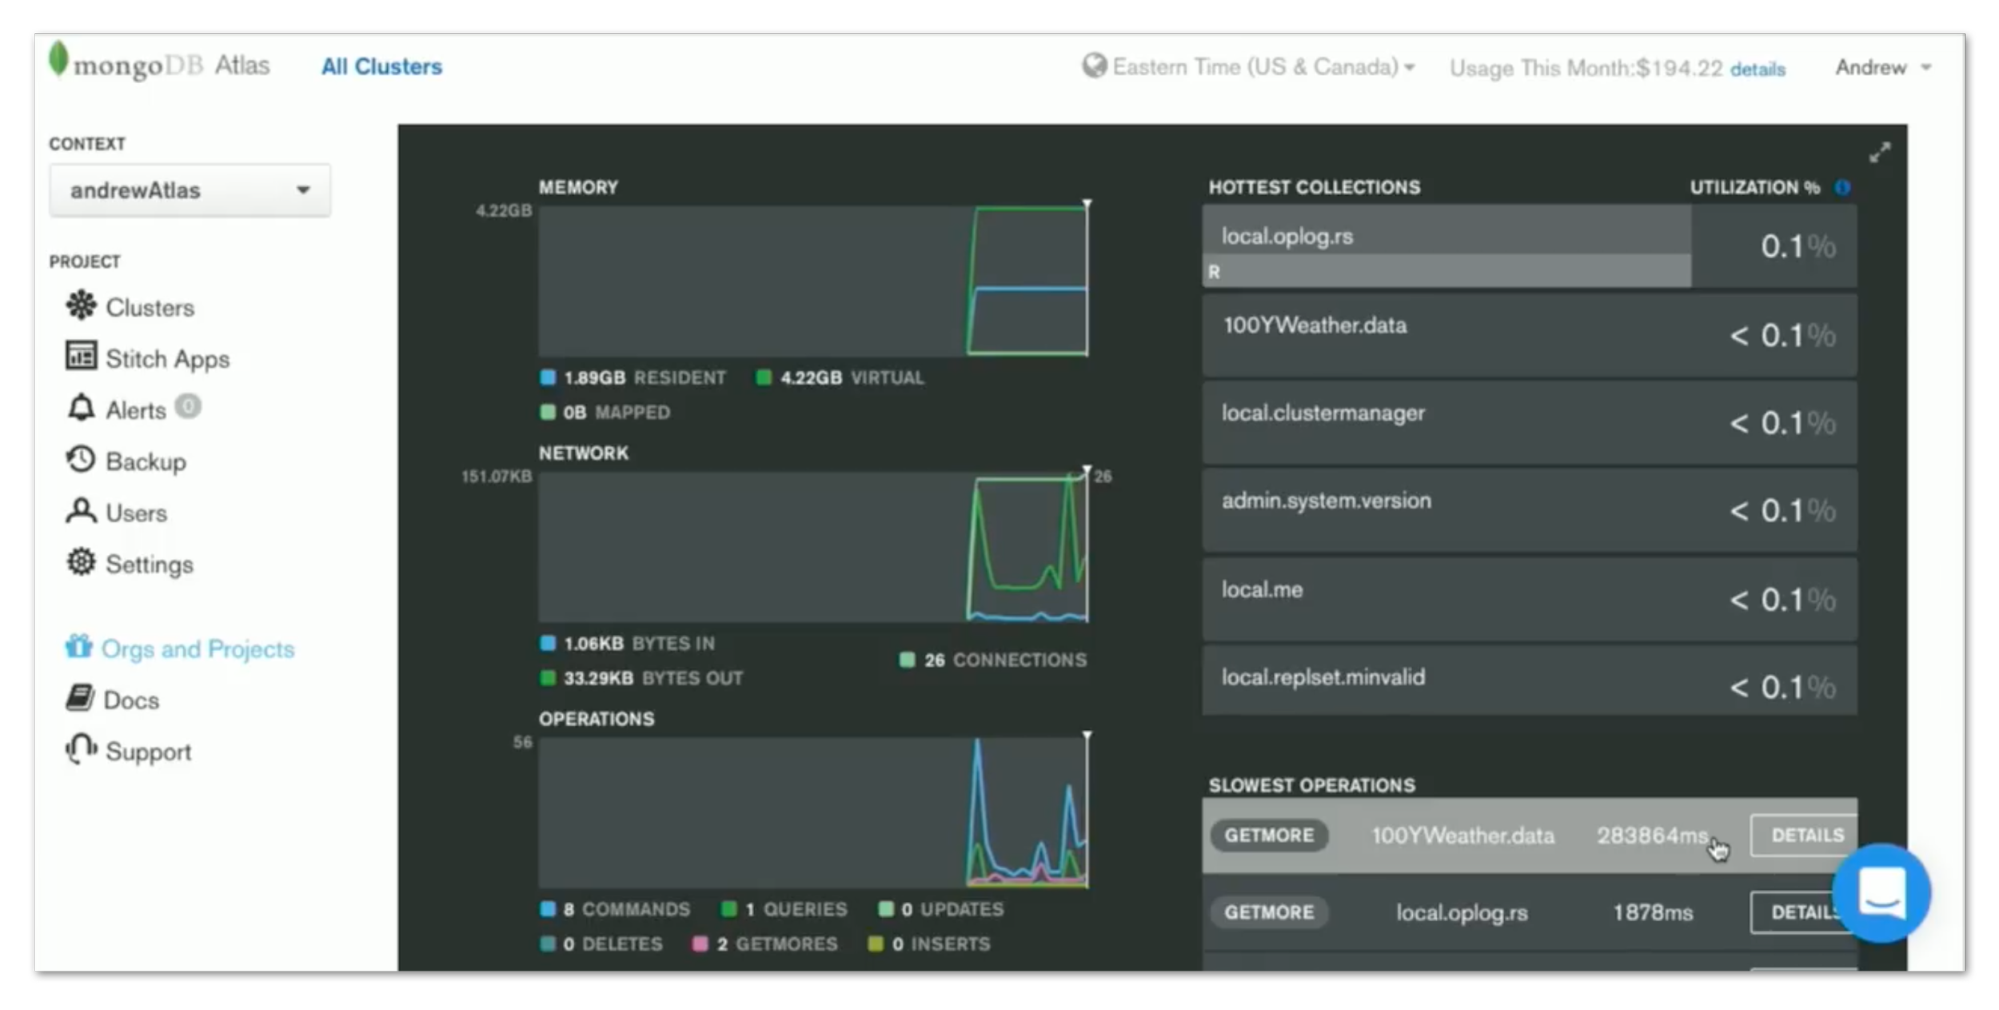
The Real-Time Performance Panel, or RTPP for short, is a dashboard that allows developers to track their MongoDB network traffic and their MongoDB instances’ database operations. This tool can be used to visually identify query runtimes, ratios of documents scanned, and general network load and throughput.
This tool also provides a list of slow-running operations and popular collections. With this information, a database manager might choose to kill some long-running operations in an emergency in order to allow normal traffic to continue.
Limitations
RTPP is mostly an operational dashboard which developers can use to keep track of live issues and inform their responses to them. It doesn't provide much in the way of actual advice or descriptive steps.
MongoDB Query Profiler

Purpose
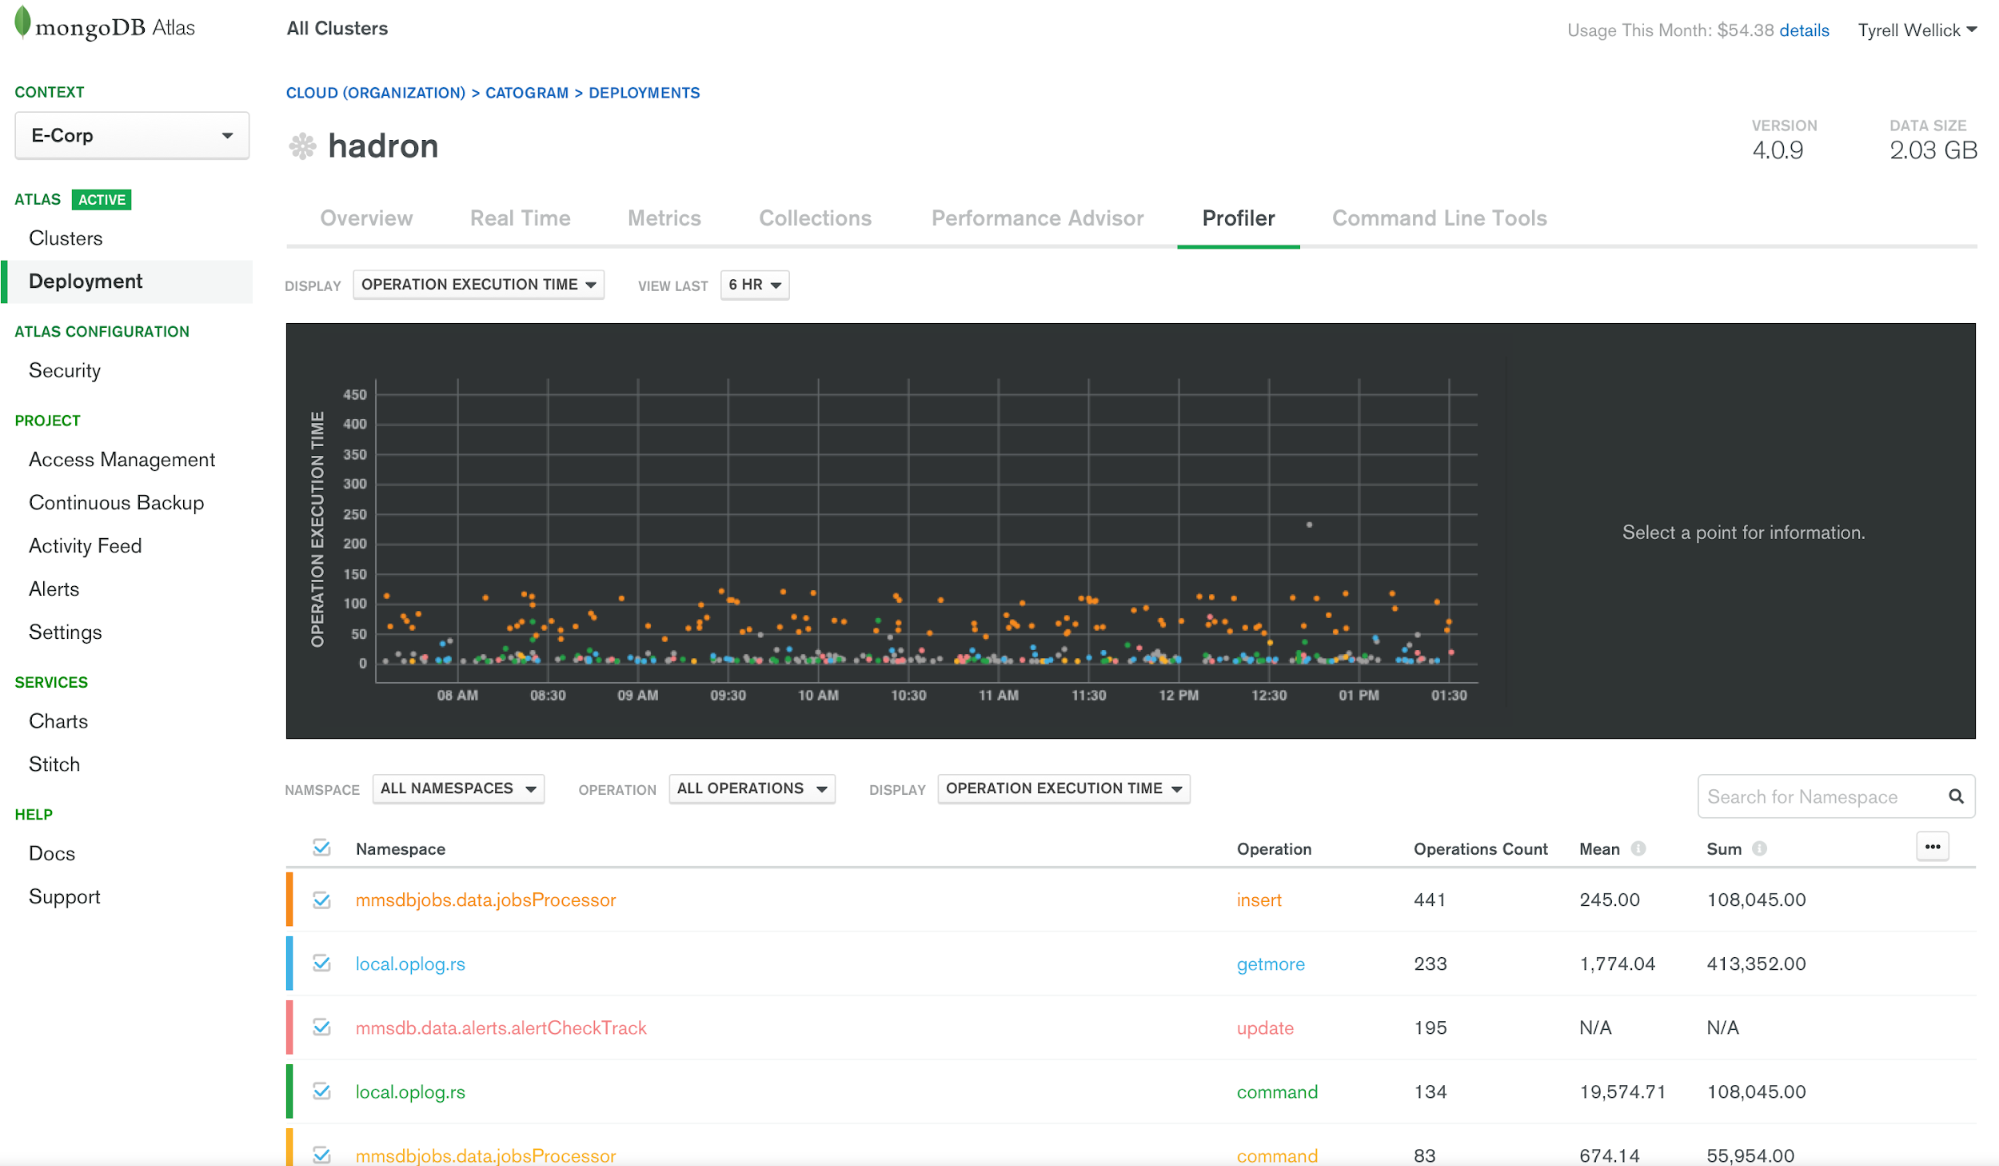
MongoDB’s Query Profiler was designed to help developers monitor query performance issues in order to improve their indexes or collection structures. By providing access to key performance statistics displayed in the Atlas UI—such as keys examined, docs returned, and response length—developers can gain insights into slow-running queries.
Query Profiler’s dashboard shows poorly performing queries and operations in chart form. These charts allow the developer to drill into each operation to see which indexes were used and which documents were hit by the MongoDB query.
Developers can click down to the specific query they’re interested in analyzing and read the query execution plan and other information describing how the query ran.
Limitations
The number of queries this tool can profile is limited. It will either analyze the most recent 10,000 query logs or the most recent 10MBs of query logs, whichever it hits first. Like RTPP, MongoDB Query Profiler only provides information. This means that your developers will need to know how to improve their queries and collection structures.
Use Cases for MongoDB Atlas Query Debugging Tools
More than likely, you’ll find yourself using more than one of these tools at a time, since, as we discussed above, some of these tools are helpful for ad hoc live issues while others are more useful for developing long-term solutions.
The sections below describe two examples of common issues that can be addressed with a combination of debugging tools.
Slowing Down to Get HTTP Requests to MongoDB Collections
Selecting back data from the database is a common procedure for web apps. Early on in an app’s development process, you might not see a problem with query speeds. Since the data will be small at that point, it will be returned quickly. However, as your data grows, your team might notice slower response times from MongoDB.
MongoDB Query Profiler can be used to see response time duration and determine whether or not it increases over time. From there, your team could check MongoDB Performance Advisor to see if it recommended any queries that would improve similar queries’ performance in the future. The reason for poor performance in queries is often related to either the lack of an index or the existence of a non-optimal index. Both of these can result in your queries’ execution plans needing to scan more documents or keys than required. The execution plan can also be seen by manually calling the function explain(“executionStats”).
Collections Not Returning
Stuck queries are another common database issue. Possible causes for them include the MongoDB instance’s server running out of CPU and the query itself trying to hit too many documents.
Regardless of the cause, you’ll need to kill this stuck query. RTPP can show you where heavy traffic is coming from while also allowing you to spot long-running queries. Its panel can be used to kill the query, preventing remaining queries from getting held up. Usually, long running queries are caused by a bad execution plan, such as one that attempts to read hundreds or even millions of documents. This can lead to servers getting stuck while the query attempts to go through all of the documents to find the information you’re searching for. A bad execution plan can be potentially remedied by having the right indexes for your query or by improving the design of your database.
Debugging Your MongoDB Queries Doesn’t Have to Be Hard
When applications based on MongoDB Atlas grow, queries inevitably slow down. And, as applications become more popular, they typically require fine tuning to improve their performance. Increasing the size and compute power of your servers might seem like an easy (albeit expensive) fix; however, this doesn’t need to be your first step. You might not need to spend more to improve your speed.
For applications using MongoDB Atlas, tools like Performance Advisor, the Real Time Performance Panel, and Query Profiler can help you address many common performance issues, like not having indexes on commonly searched collections or having sub-optimal indexes on collections. Although these solutions are limited by their specific features—such as post-hoc analysis of query runtimes or real-time indicators of performance—they can often be combined to address an issue.
There are other ways your team can improve database performance as well, especially for analytical queries that probably shouldn’t be running on your MongoDB instance in the first place. You can offload analytics queries by implementing them on Rockset, which serves as an external indexing system for your MongoDB data. By indexing your data, Rockset improves the overall performance of your application without requiring you to purchase more powerful servers.
Ben has spent his career focused on all forms of data. He has focused on developing algorithms to detect fraud, reduce patient readmission and redesign insurance provider policy to help reduce the overall cost of healthcare. He has also helped develop analytics for marketing and IT operations in order to optimize limited resources such as employees and budget. Ben privately consults on data science and engineering problems. He has experience both working hands-on with technical problems as well as helping leadership teams develop strategies to maximize their data.
