Using Tableau with Kafka: How to Build a Real-Time SQL Dashboard on Streaming Data
October 10, 2019
In this blog, we walk through how to build a real-time dashboard for operational monitoring and analytics on streaming event data from Kafka, which often requires complex SQL, including filtering, aggregations, and joins with other data sets.
Apache Kafka is a widely used distributed data log built to handle streams of unstructured and semi-structured event data at massive scales. Kafka is often used by organizations to track live application events ranging from sensor data to user activity, and the ability to visualize and dig deeper into this data can be essential to understanding business performance.
Tableau, also widely popular, is a tool for building interactive dashboards and visualizations.
In this post, we will create an example real-time Tableau dashboard on streaming data in Kafka in a series of easy steps, with no upfront schema definition or ETL involved. We’ll use Rockset as a data sink that ingests, indexes, and makes the Kafka data queryable using SQL, and JDBC to connect Tableau and Rockset.
Streaming Data from Reddit
For this example, let’s look at real-time Reddit activity over the course of a week. As opposed to posts, let’s look at comments - perhaps a better proxy for engagement. We’ll use the Kafka Connect Reddit source connector to pipe new Reddit comments into our Kafka cluster. Each individual comment looks like this:
{
    "payload":{
        "controversiality":0,
        "name":"t1_ez72epm",
        "body":"I love that they enjoyed it too! Thanks!",
        "stickied":false,
        "replies":{
            "data":{
                "children":[]
            },
            "kind":"Listing"
        },
        "saved":false,
        "archived":false,
        "can_gild":true,
        "gilded":0,
        "score":1,
        "author":"natsnowchuk",
        "link_title":"Our 4 month old loves “airplane” rides. Hoping he enjoys the real airplane ride this much in December.",
        "parent_id":"t1_ez6v8xa",
        "created_utc":1567718035,
        "subreddit_type":"public",
        "id":"ez72epm",
        "subreddit_id":"t5_2s3i3",
        "link_id":"t3_d0225y",
        "link_author":"natsnowchuk",
        "subreddit":"Mommit",
        "link_url":"https://v.redd.it/pd5q8b4ujsk31",
        "score_hidden":false
    }
}
Connecting Kafka to Rockset
For this demo, I’ll assume we already have set up our Kafka topic, installed the Confluent Reddit Connector and followed the accompanying instructions to set up a comments topic processing all new comments from Reddit in real-time.
To get this data into Rockset, we’ll first need to create a new Kafka integration in Rockset. All we need for this step is the name of the Kafka topic that we’d like to use as a data source, and the type of that data (JSON / Avro).
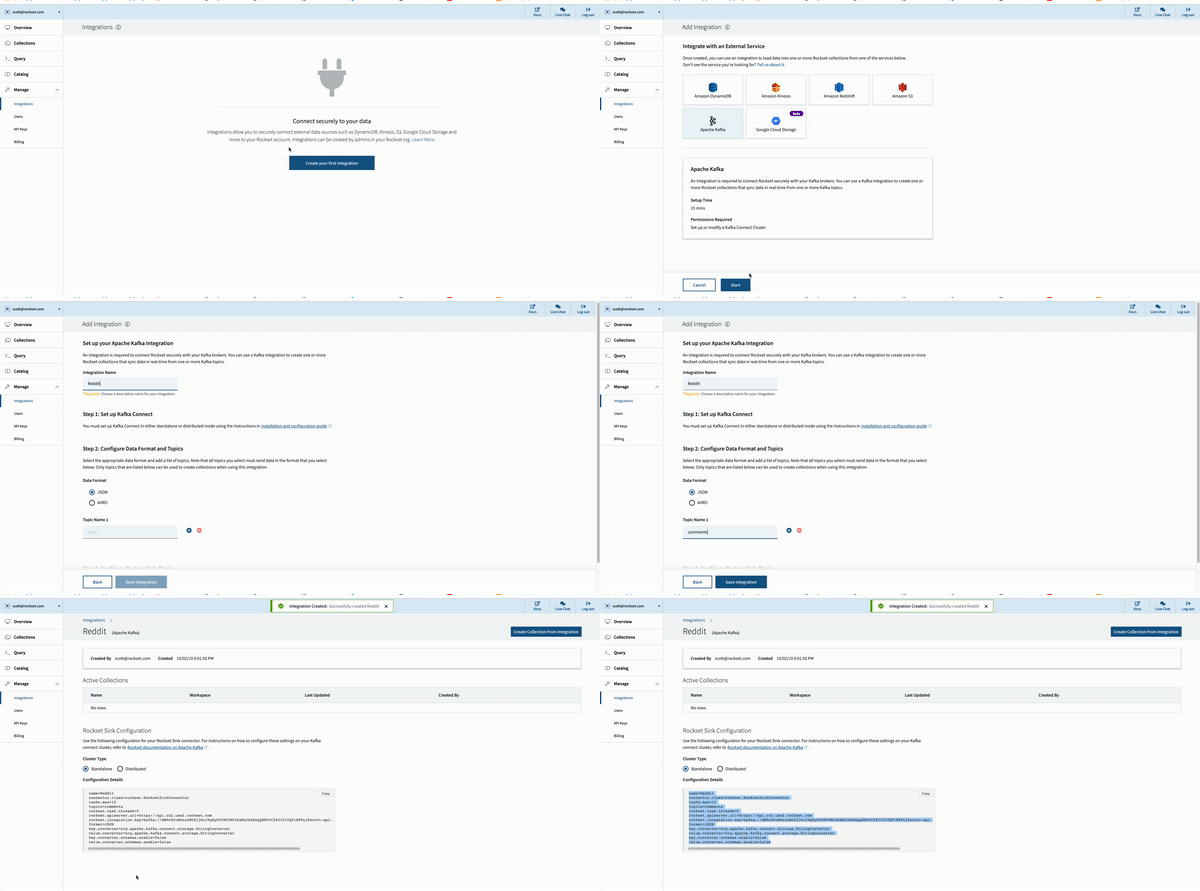
Once we’ve created the integration, we can see a list of attributes that we need to use to set up our Kafka Connect connector. For the purposes of this demo, we’ll use the Confluent Platform to manage our cluster, but for self-hosted Kafka clusters these attributes can be copied into the relevant .properties file as specified here. However so long as we have the Rockset Kafka Connector installed, we can add these manually in the Kafka UI:
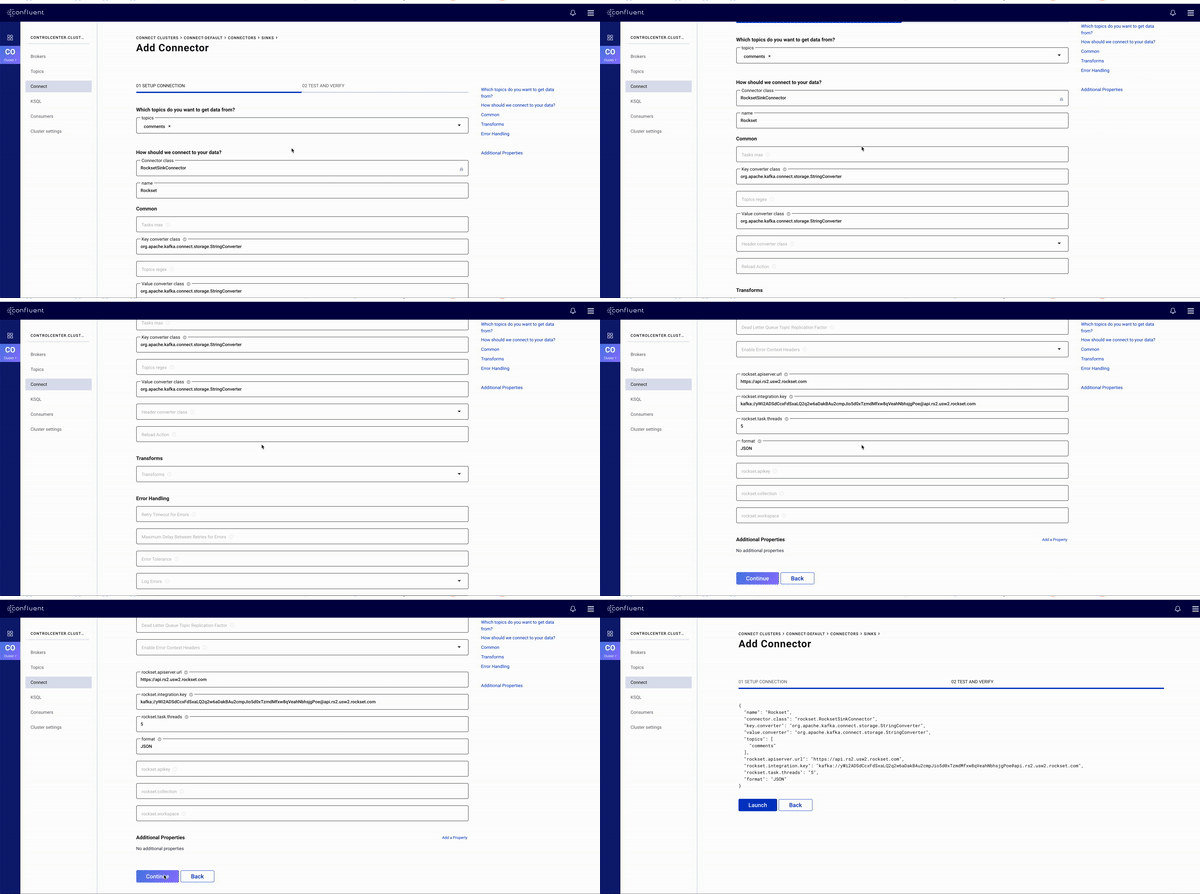
Now that we have the Rockset Kafka Sink set up, we can create a Rockset collection and start ingesting data!
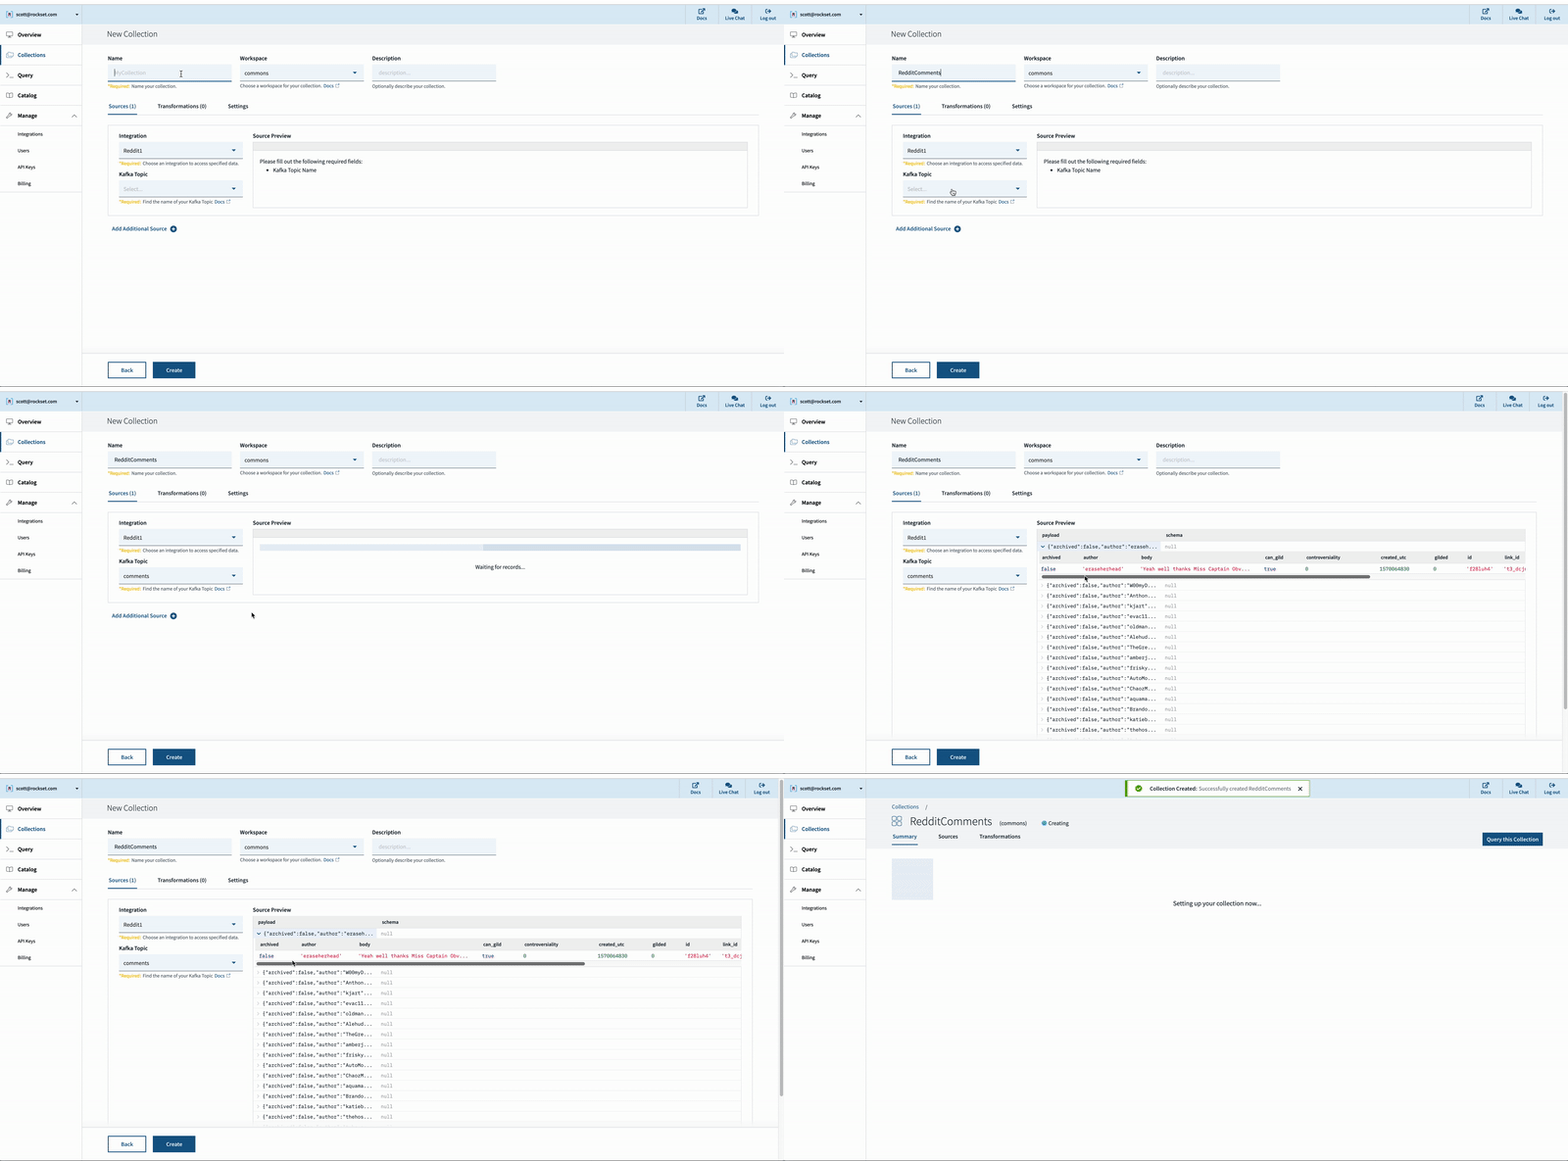
We now have data streaming live from Reddit directly into into Rockset via Kafka, without having to worry about schemas or ETL at all.
Connecting Rockset to Tableau
Let’s see this data in Tableau!
I’ll assume we have an account already for Tableau Desktop.
To connect Tableau with Rockset, we first need to download the Rockset JDBC driver from Maven and place it in ~/Library/Tableau/Drivers for Mac or C:\Program Files\Tableau\Drivers for Windows.
Next, let’s create an API key in Rockset that Tableau will use for authenticating requests:
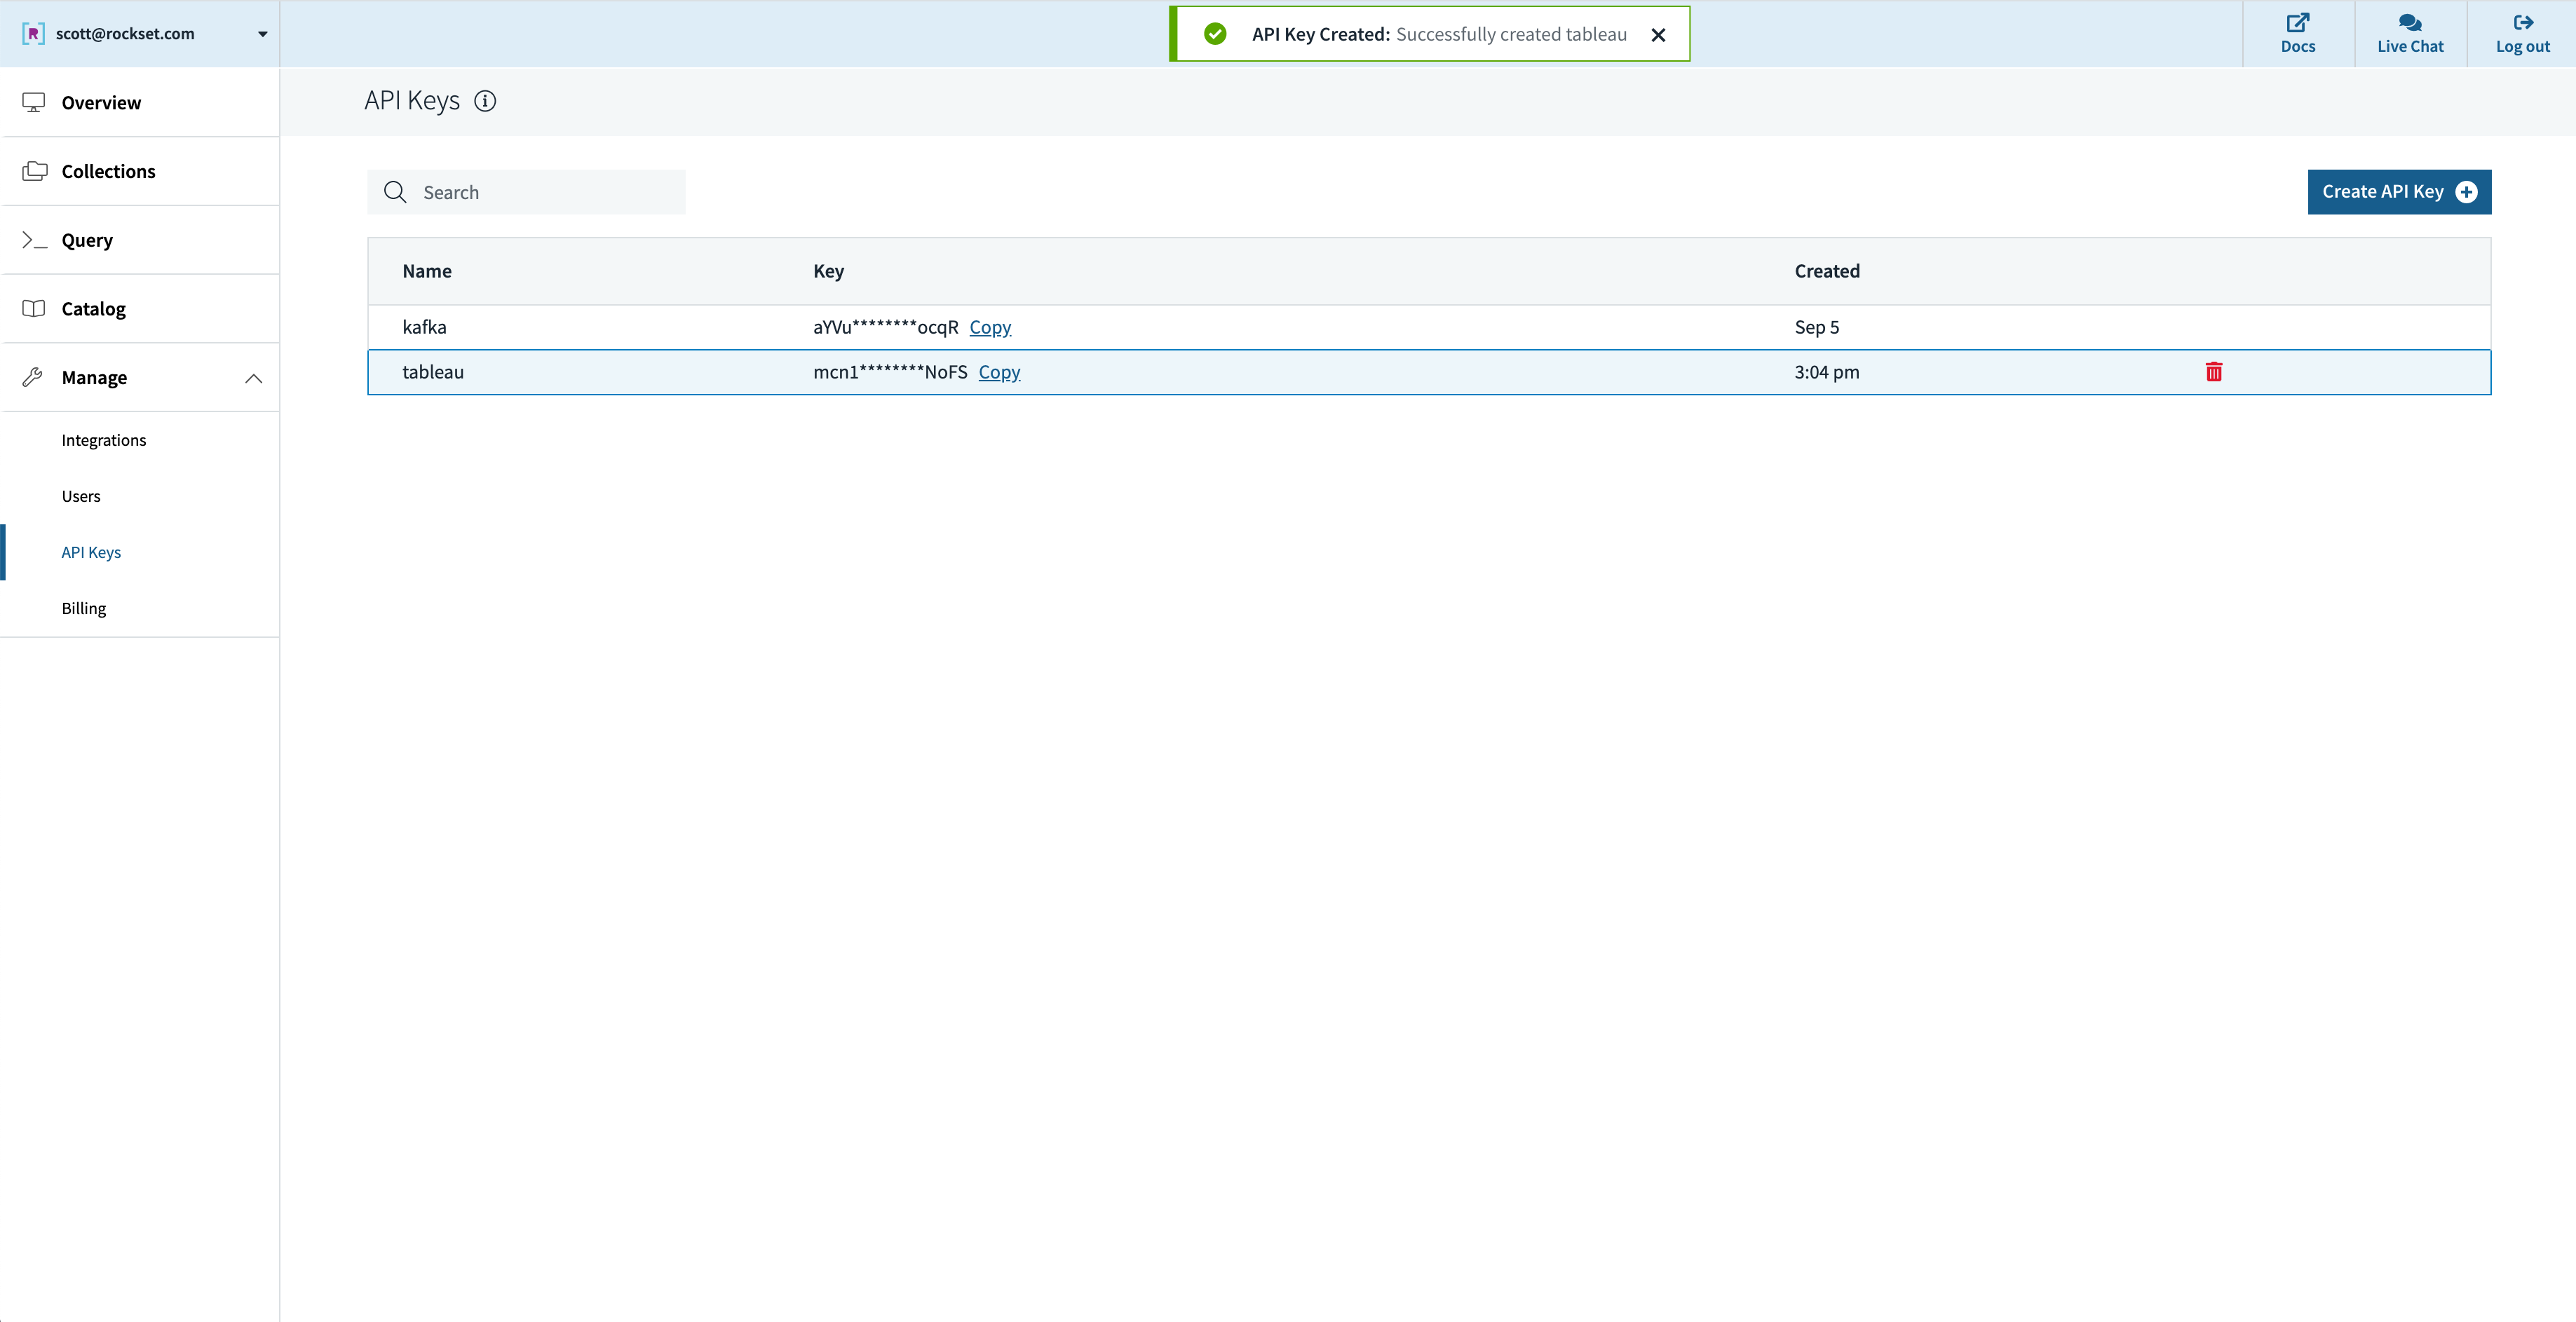
In Tableau, we connect to Rockset by choosing “Other Databases (JDBC)” and filling the fields, with our API key as the password:
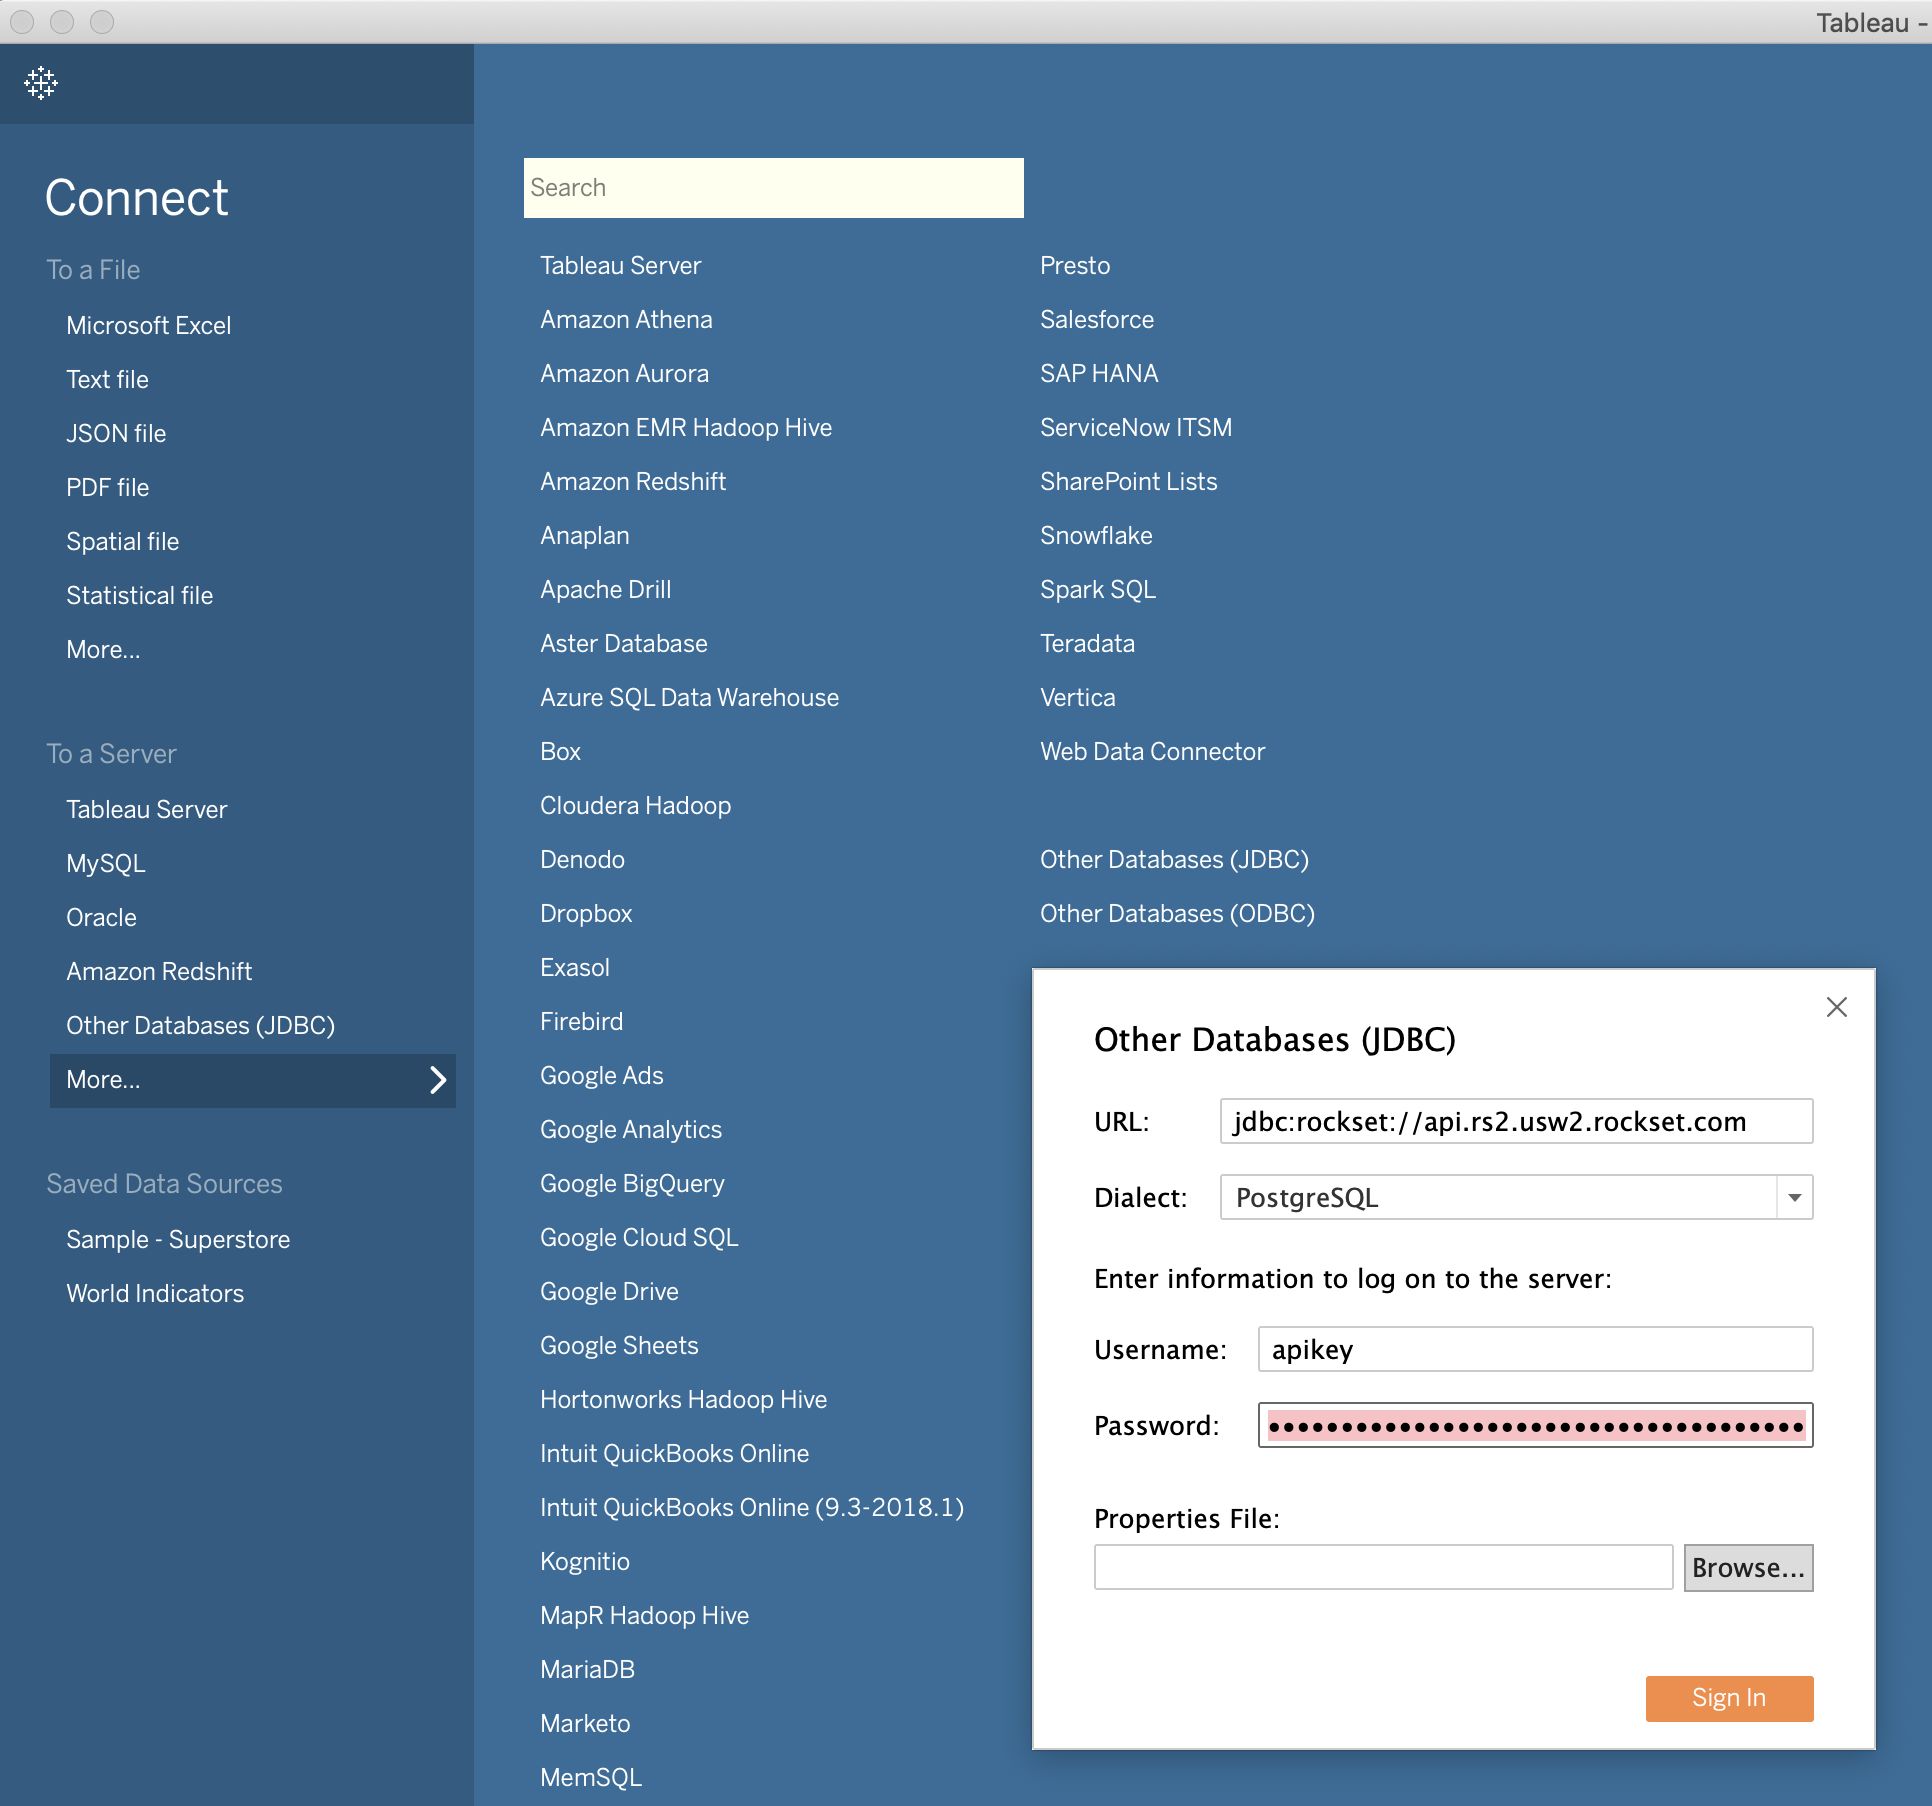
That’s all it takes!
Creating real-time dashboards
Now that we have data streaming into Rockset, we can start asking questions. Given the nature of the data, we’ll write the queries we need first in Rockset, and then use them to power our live Tableau dashboards using the ‘Custom SQL’ feature.
Let’s first look at the nature of the data in Rockset:
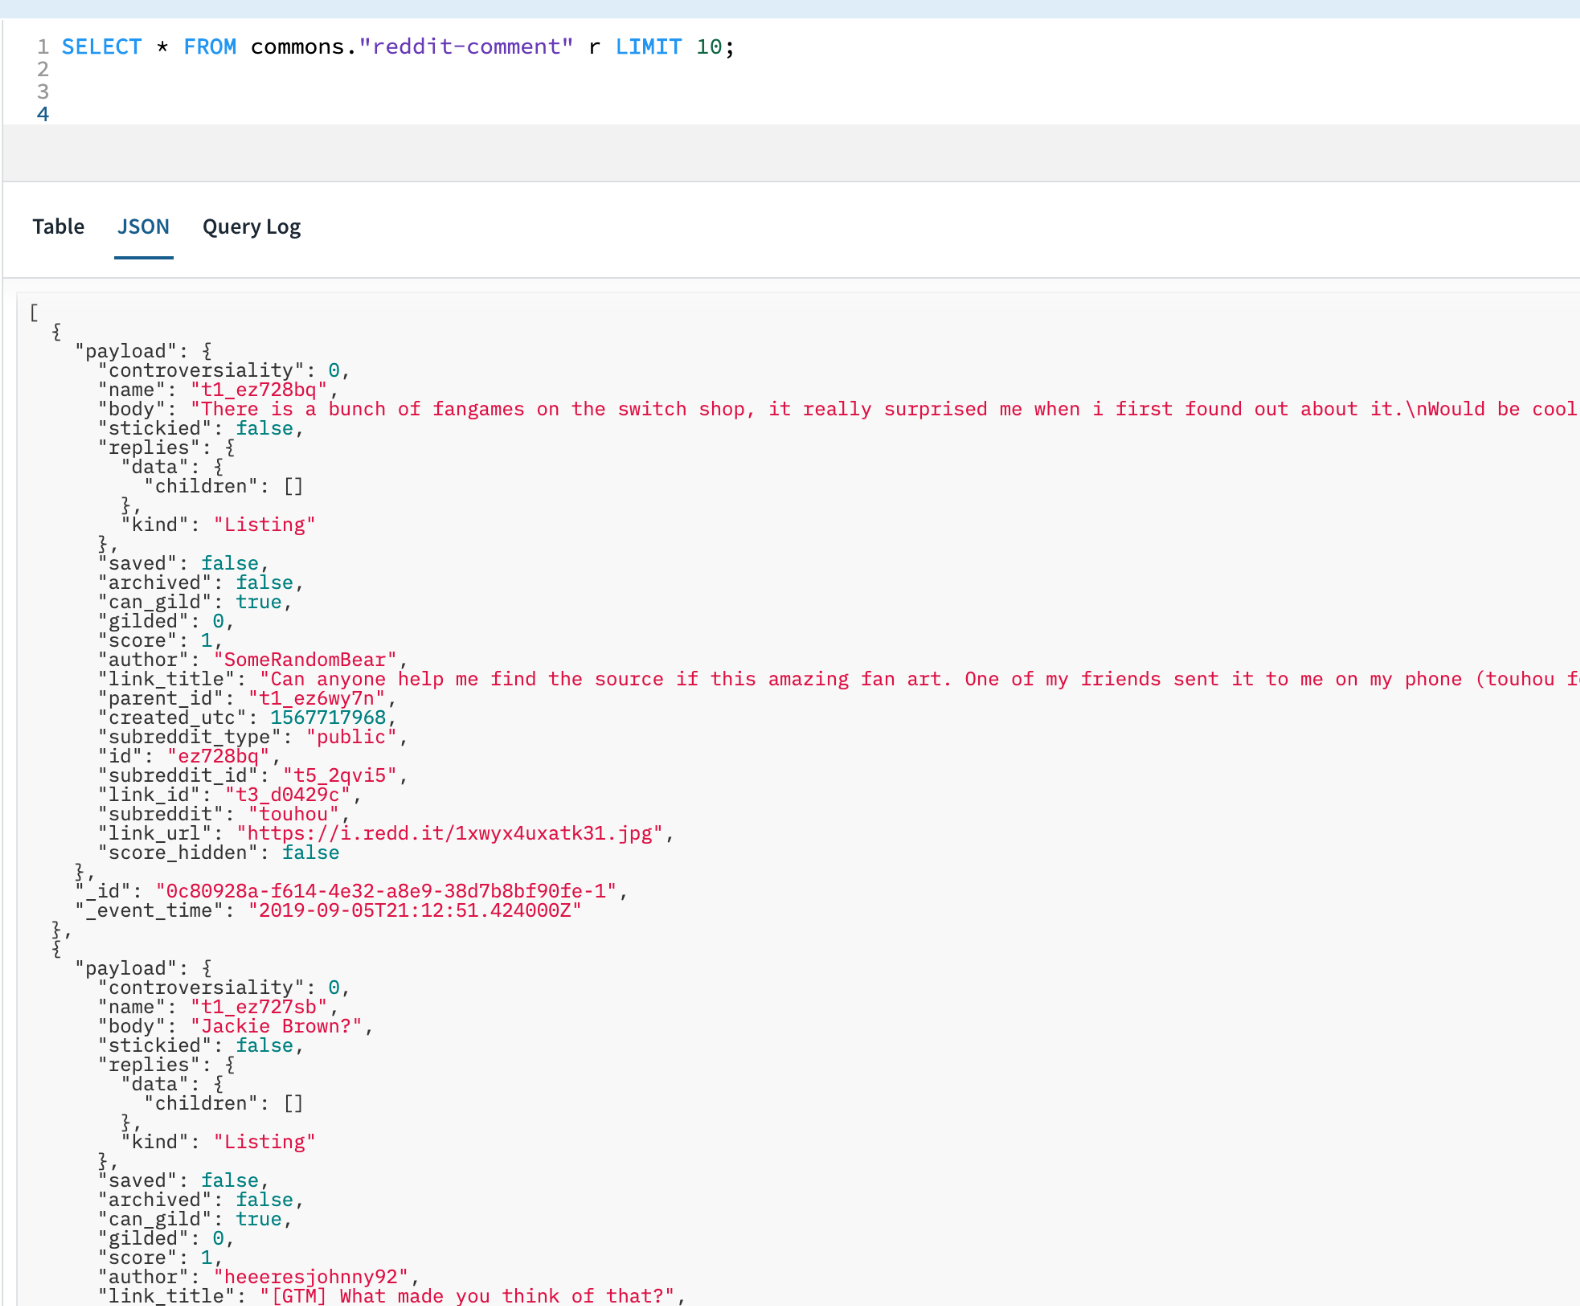
Given the nested nature of most of the primary fields, we won’t be able to use Tableau to directly access them. Instead, we’ll write the SQL ourselves in Rockset and use the ‘Custom SQL’ option to bring it into Tableau.
To start with, let’s explore general Reddit trends of the last week. If comments reflect engagement, which subreddits have the most engaged users? We can write a basic query to find the subreddits with the highest activity over the last week:
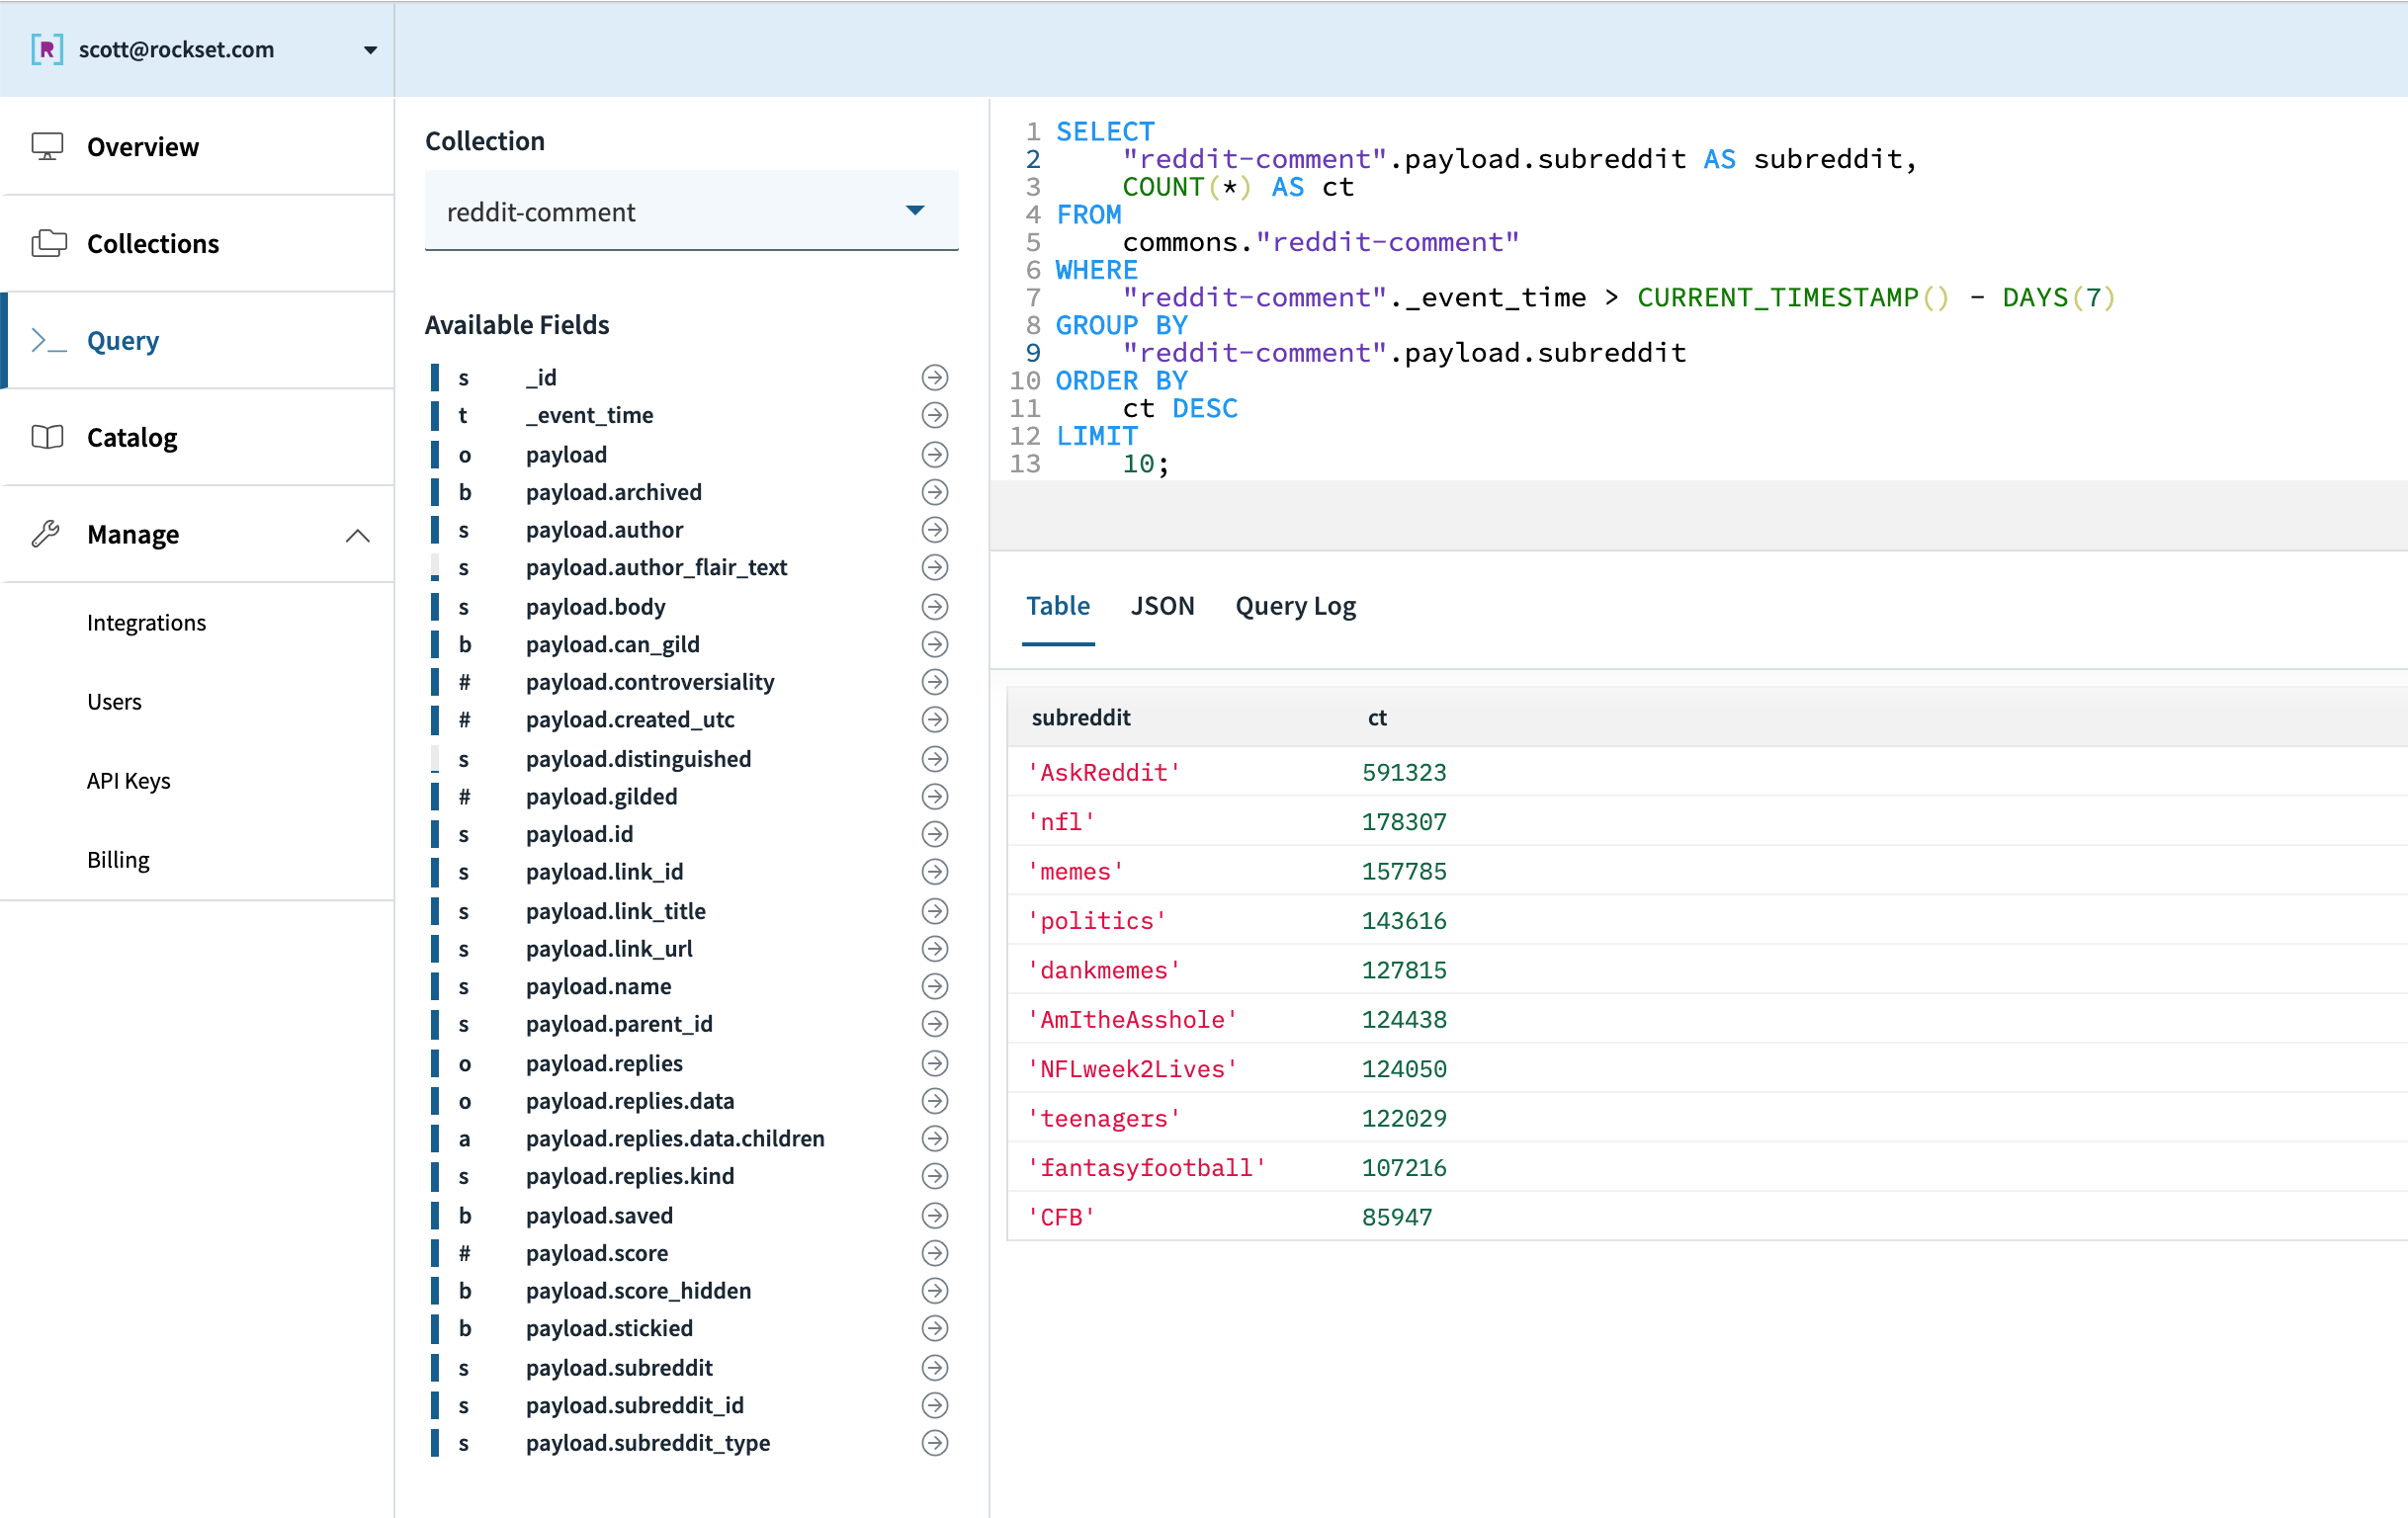
We can easily create a custom SQL data source to represent this query and view the results in Tableau:

Here’s the final chart after collecting a week of data:
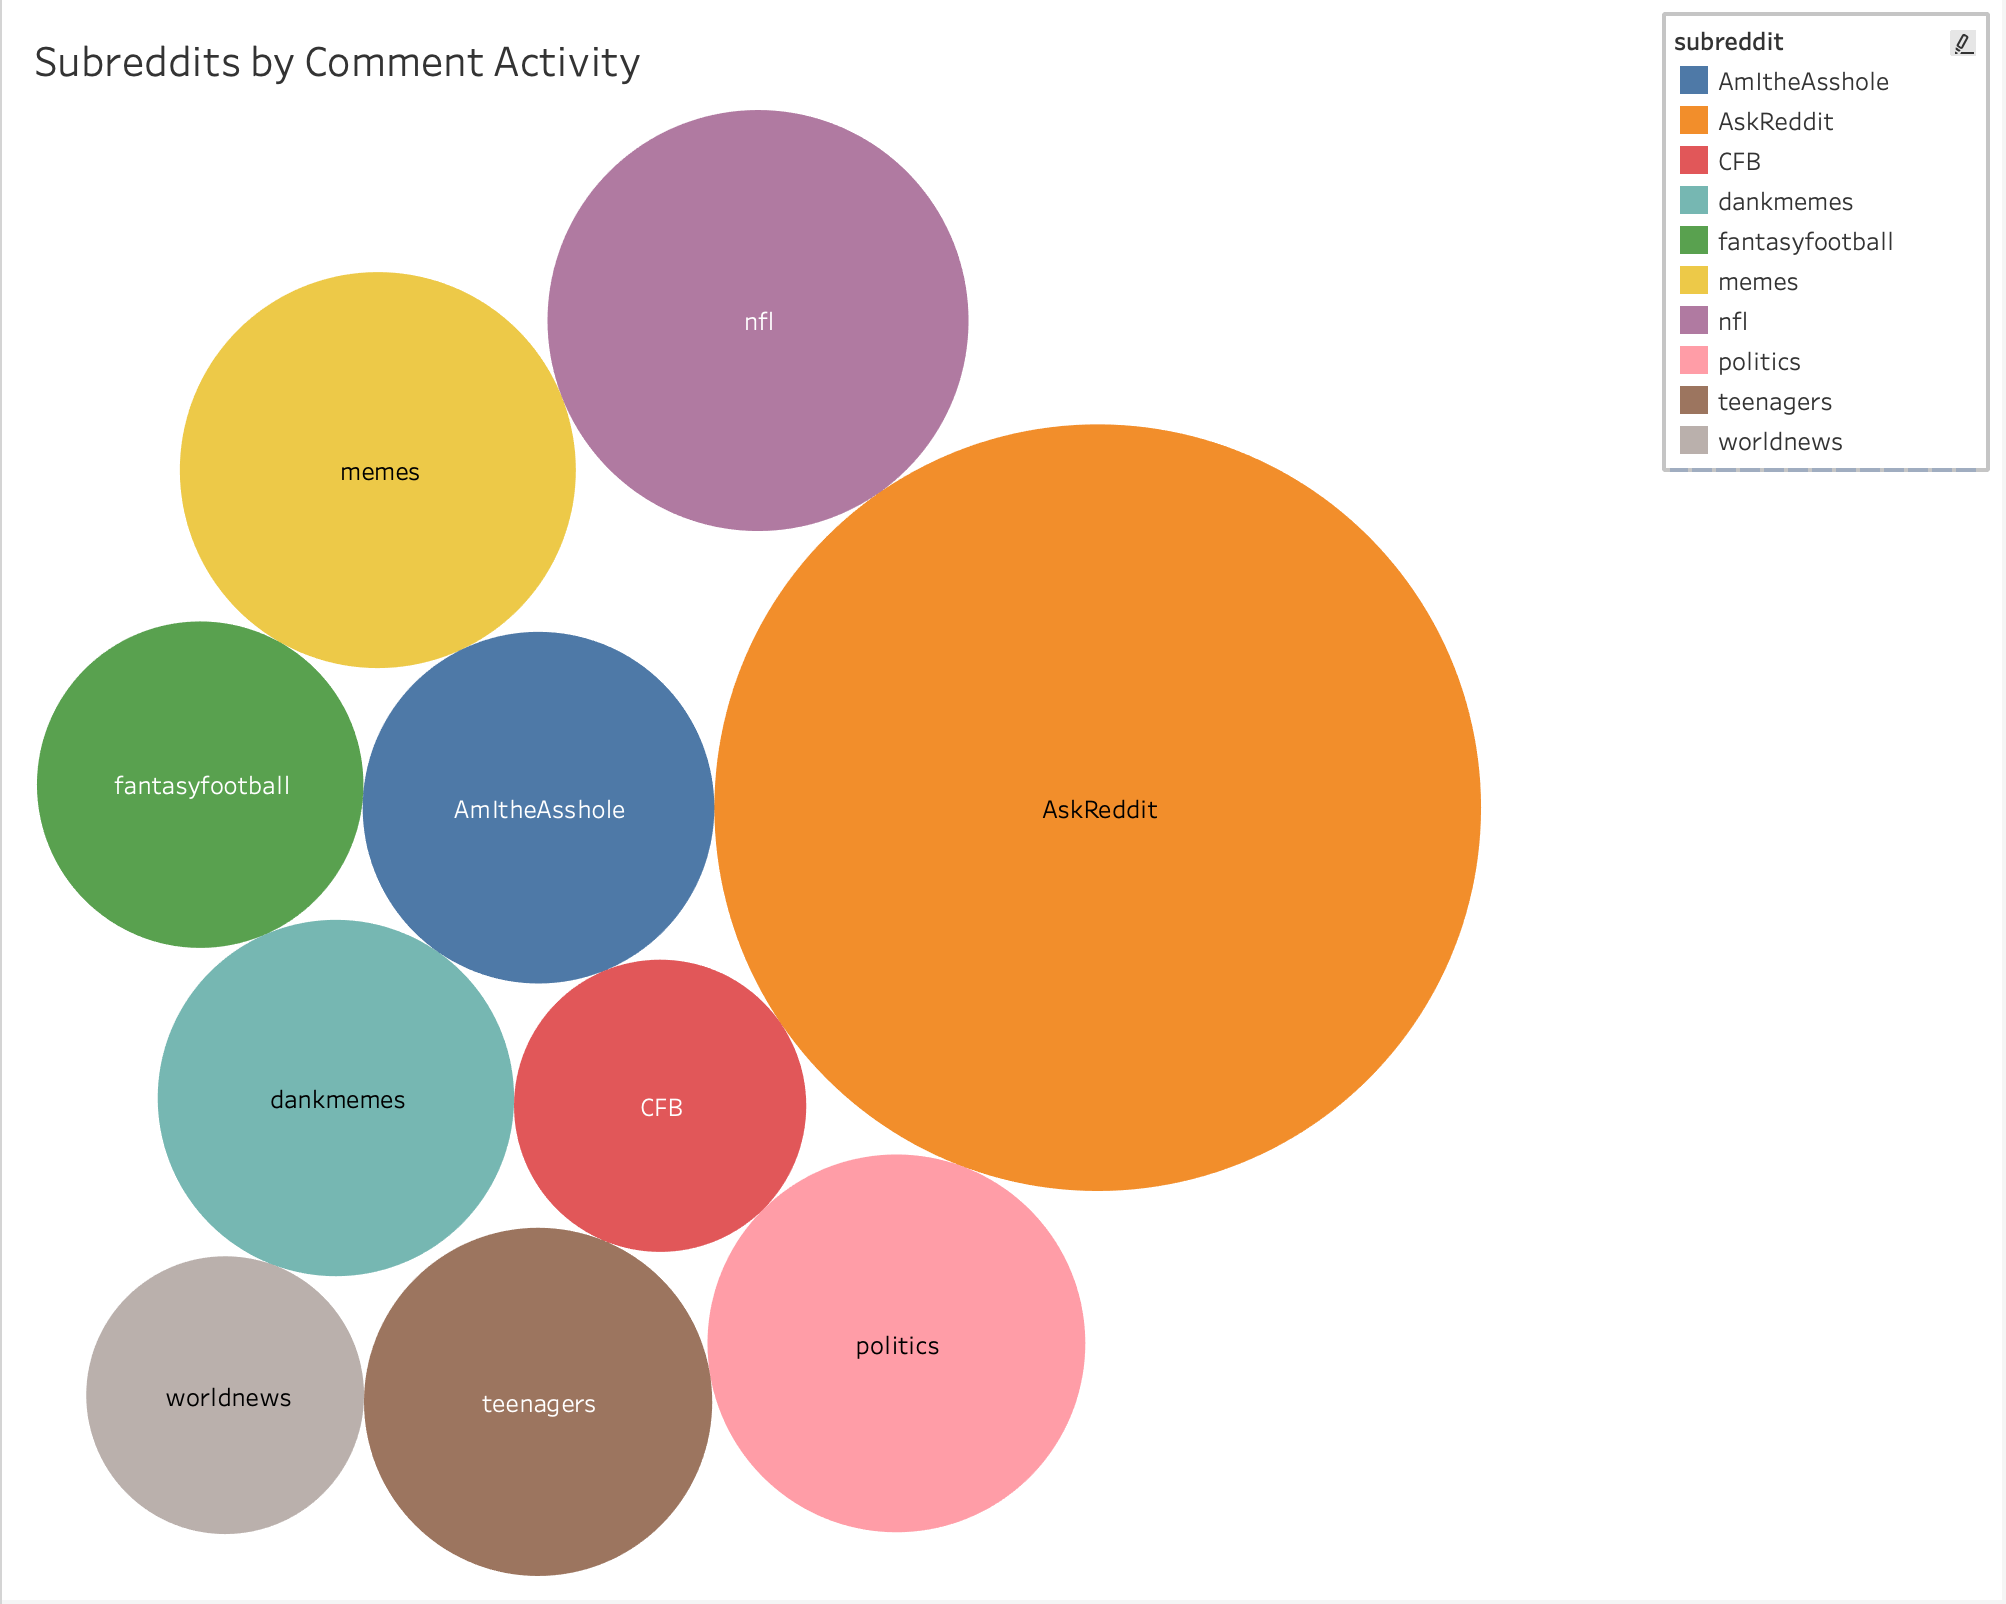
Interestingly, Reddit seems to love football — we see 3 football-related Reddits in the top 10 (r/nfl, r/fantasyfootball, and r/CFB). Or at the very least, those Redditors who love football are highly active at the start of the season. Let’s dig into this a bit more - are there any activity patterns we can observe in day-to-day subreddit activity? One might hypothesize that NFL-related subreddits spike on Sundays, while those NCAA-related spike instead on Saturdays.
To answer this question, let’s write a query to bucket comments per subreddit per hour and plot the results. We’ll need some subqueries to find the top overall subreddits:
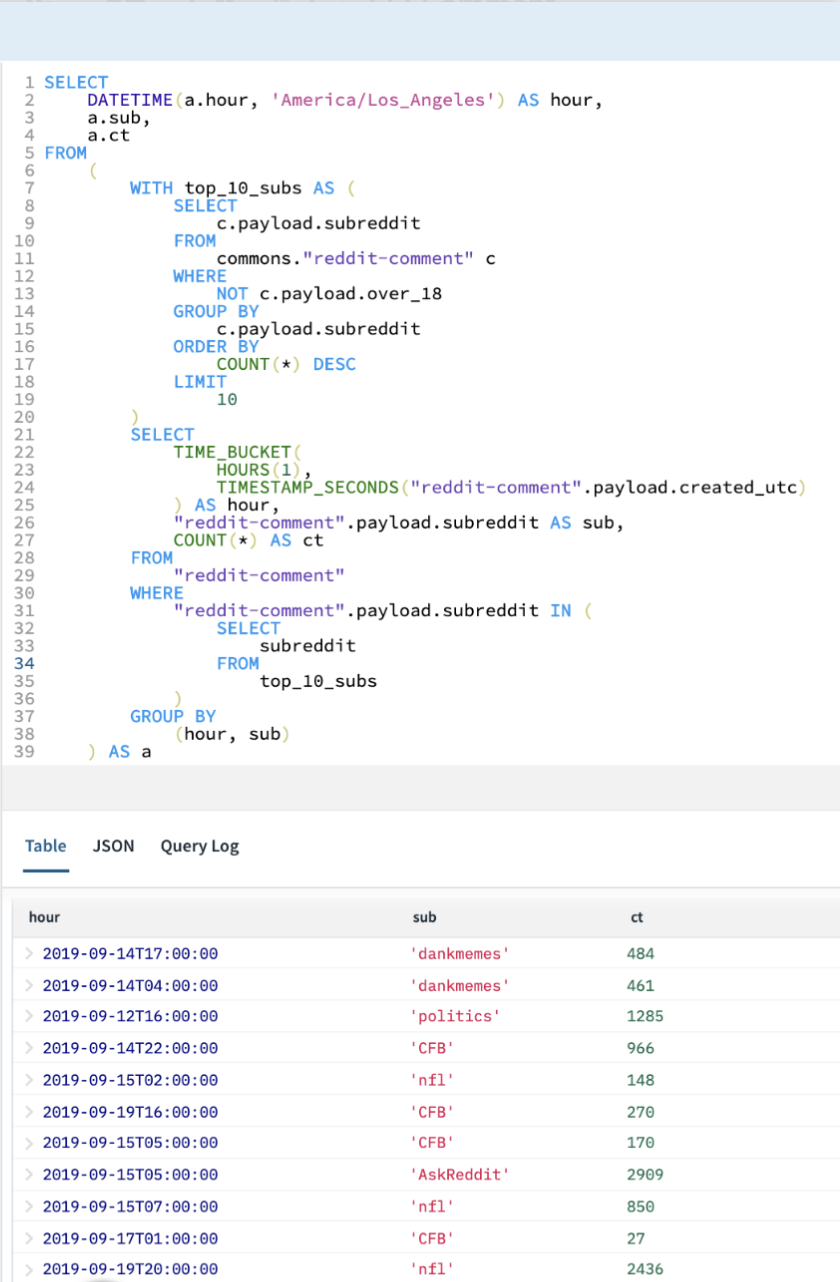
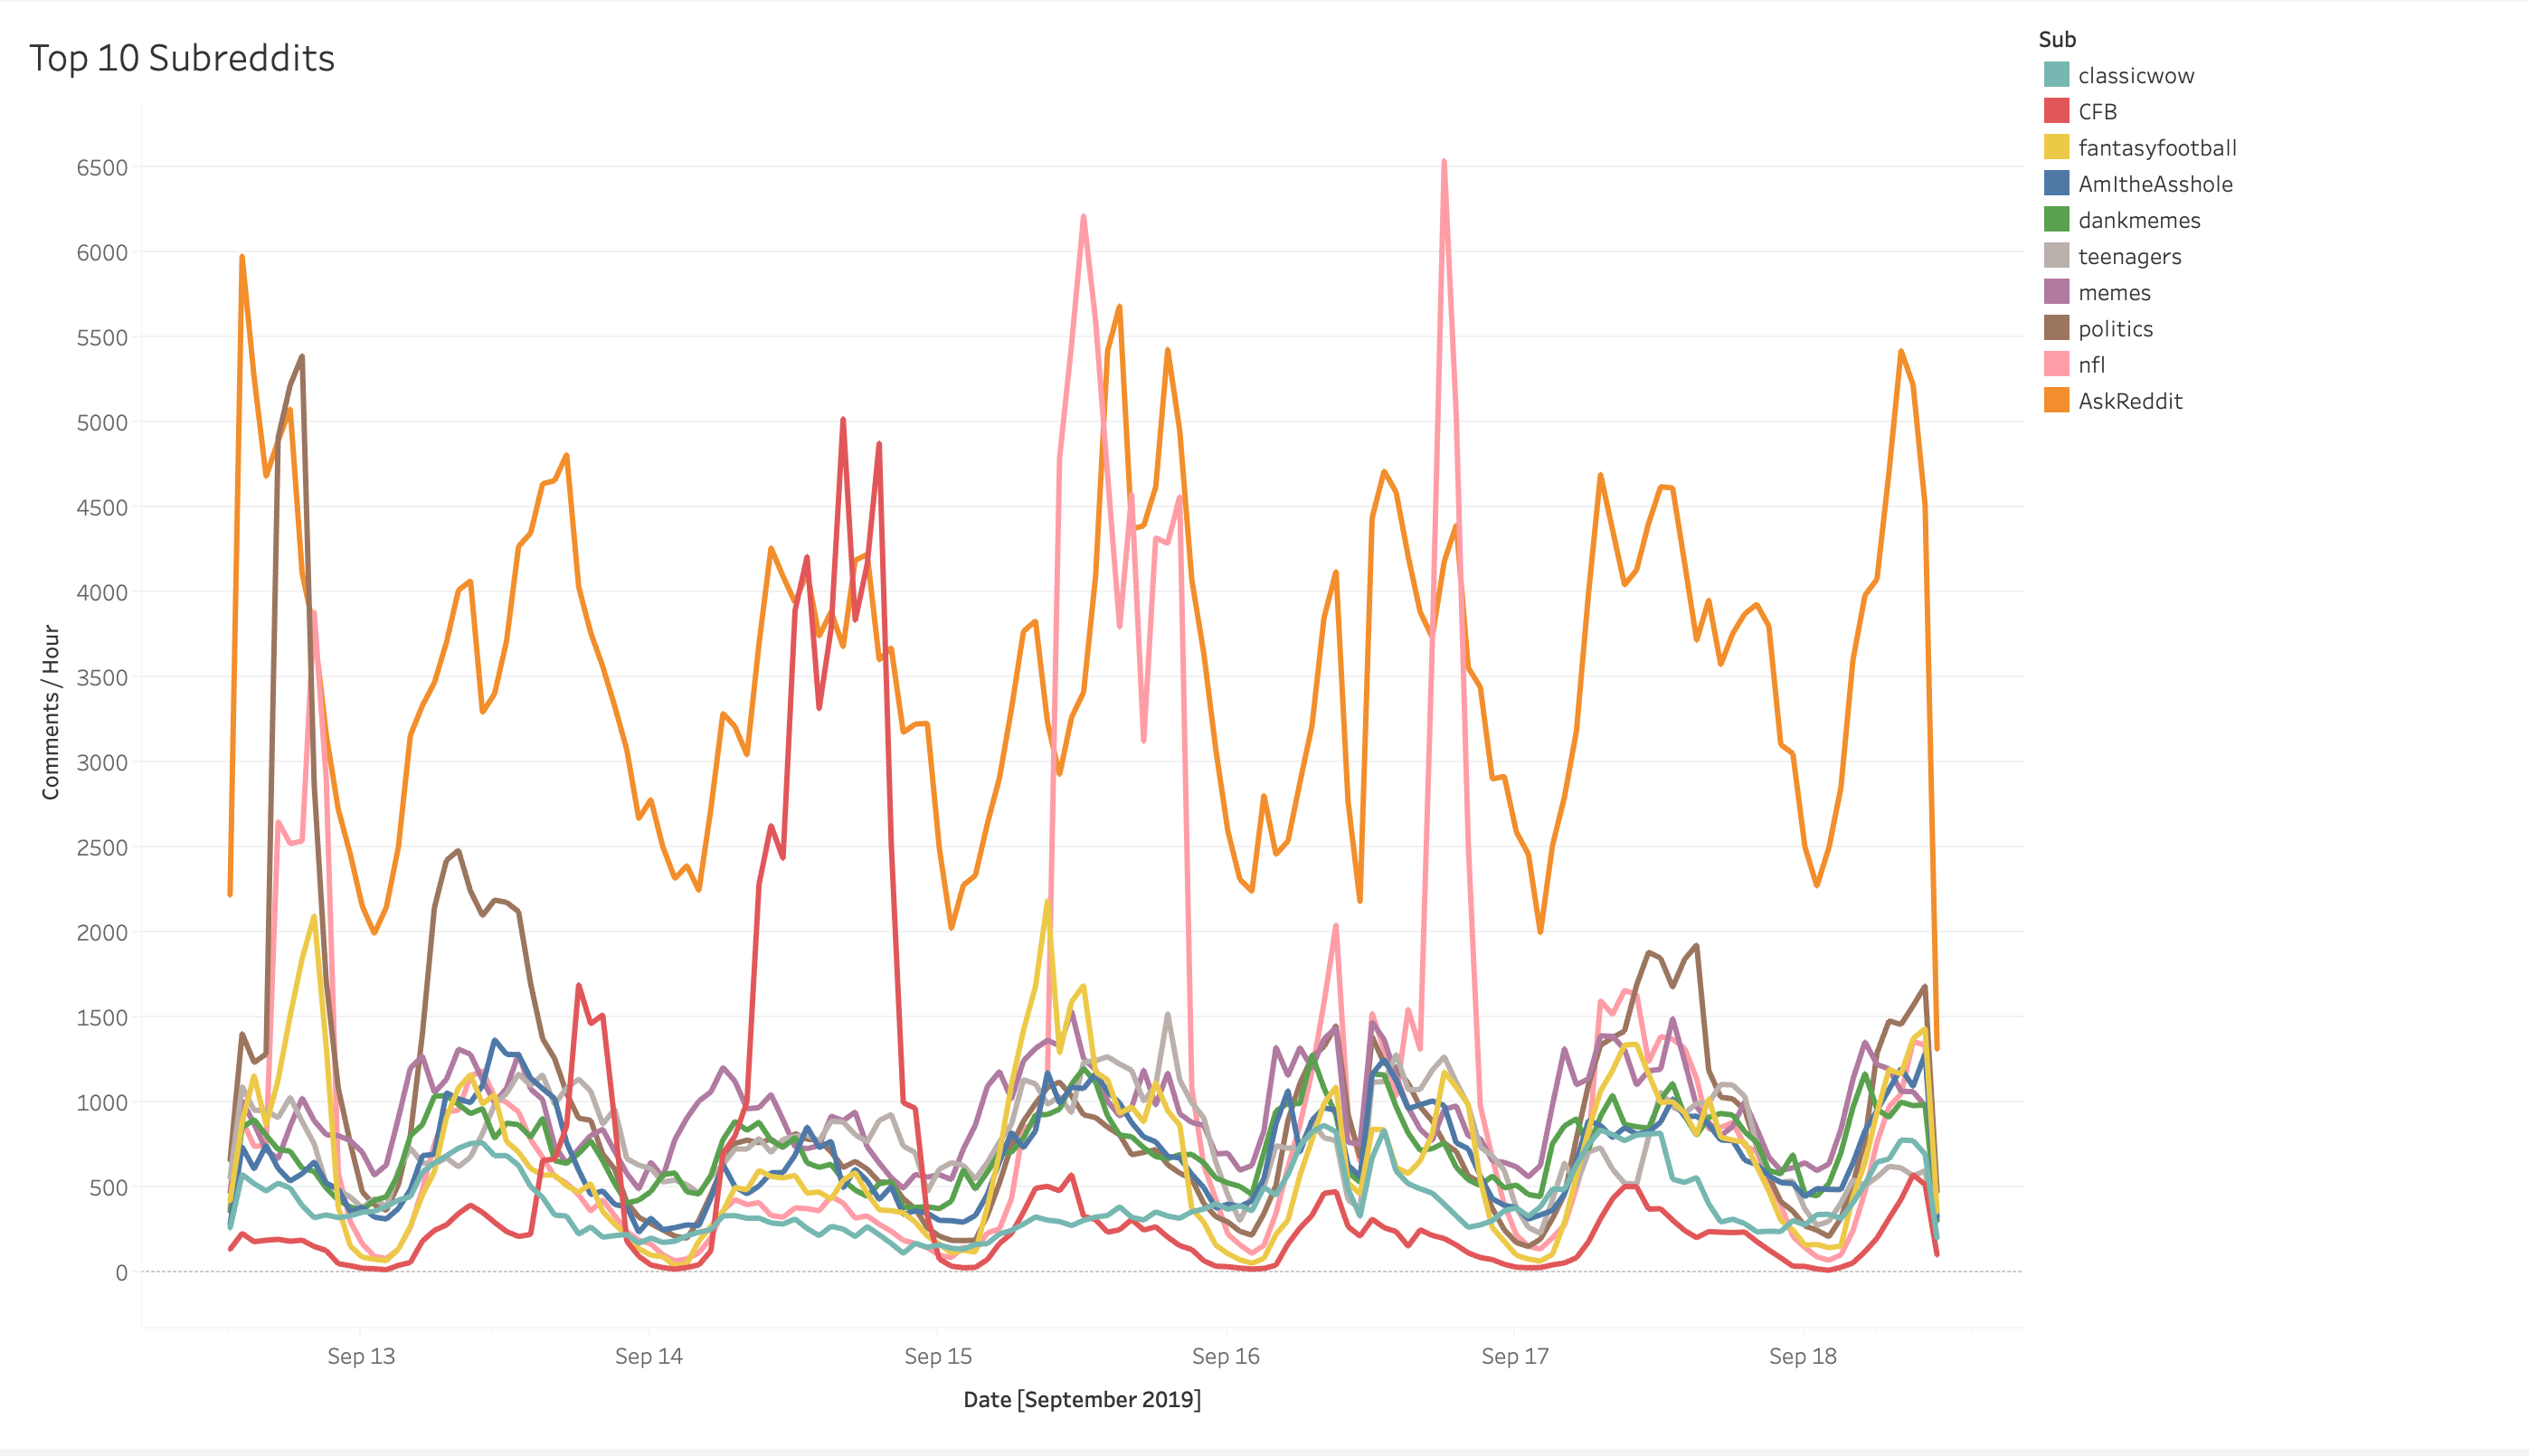
Unsurprisingly, we do see large spikes for r/CFB on Saturday and an even larger spike for r/nfl on Sunday (although somewhat surprisingly, the most active single hour of the week on r/nfl occurred on Monday Night Football as Baker Mayfield led the Browns to a convincing victory over the injury-plagued Jets). Also interestingly, peak game-day activity in r/nfl surpassed the highs of any other subreddit at any other 1 hour interval, including r/politics during the Democratic Primary Debate the previous Monday.
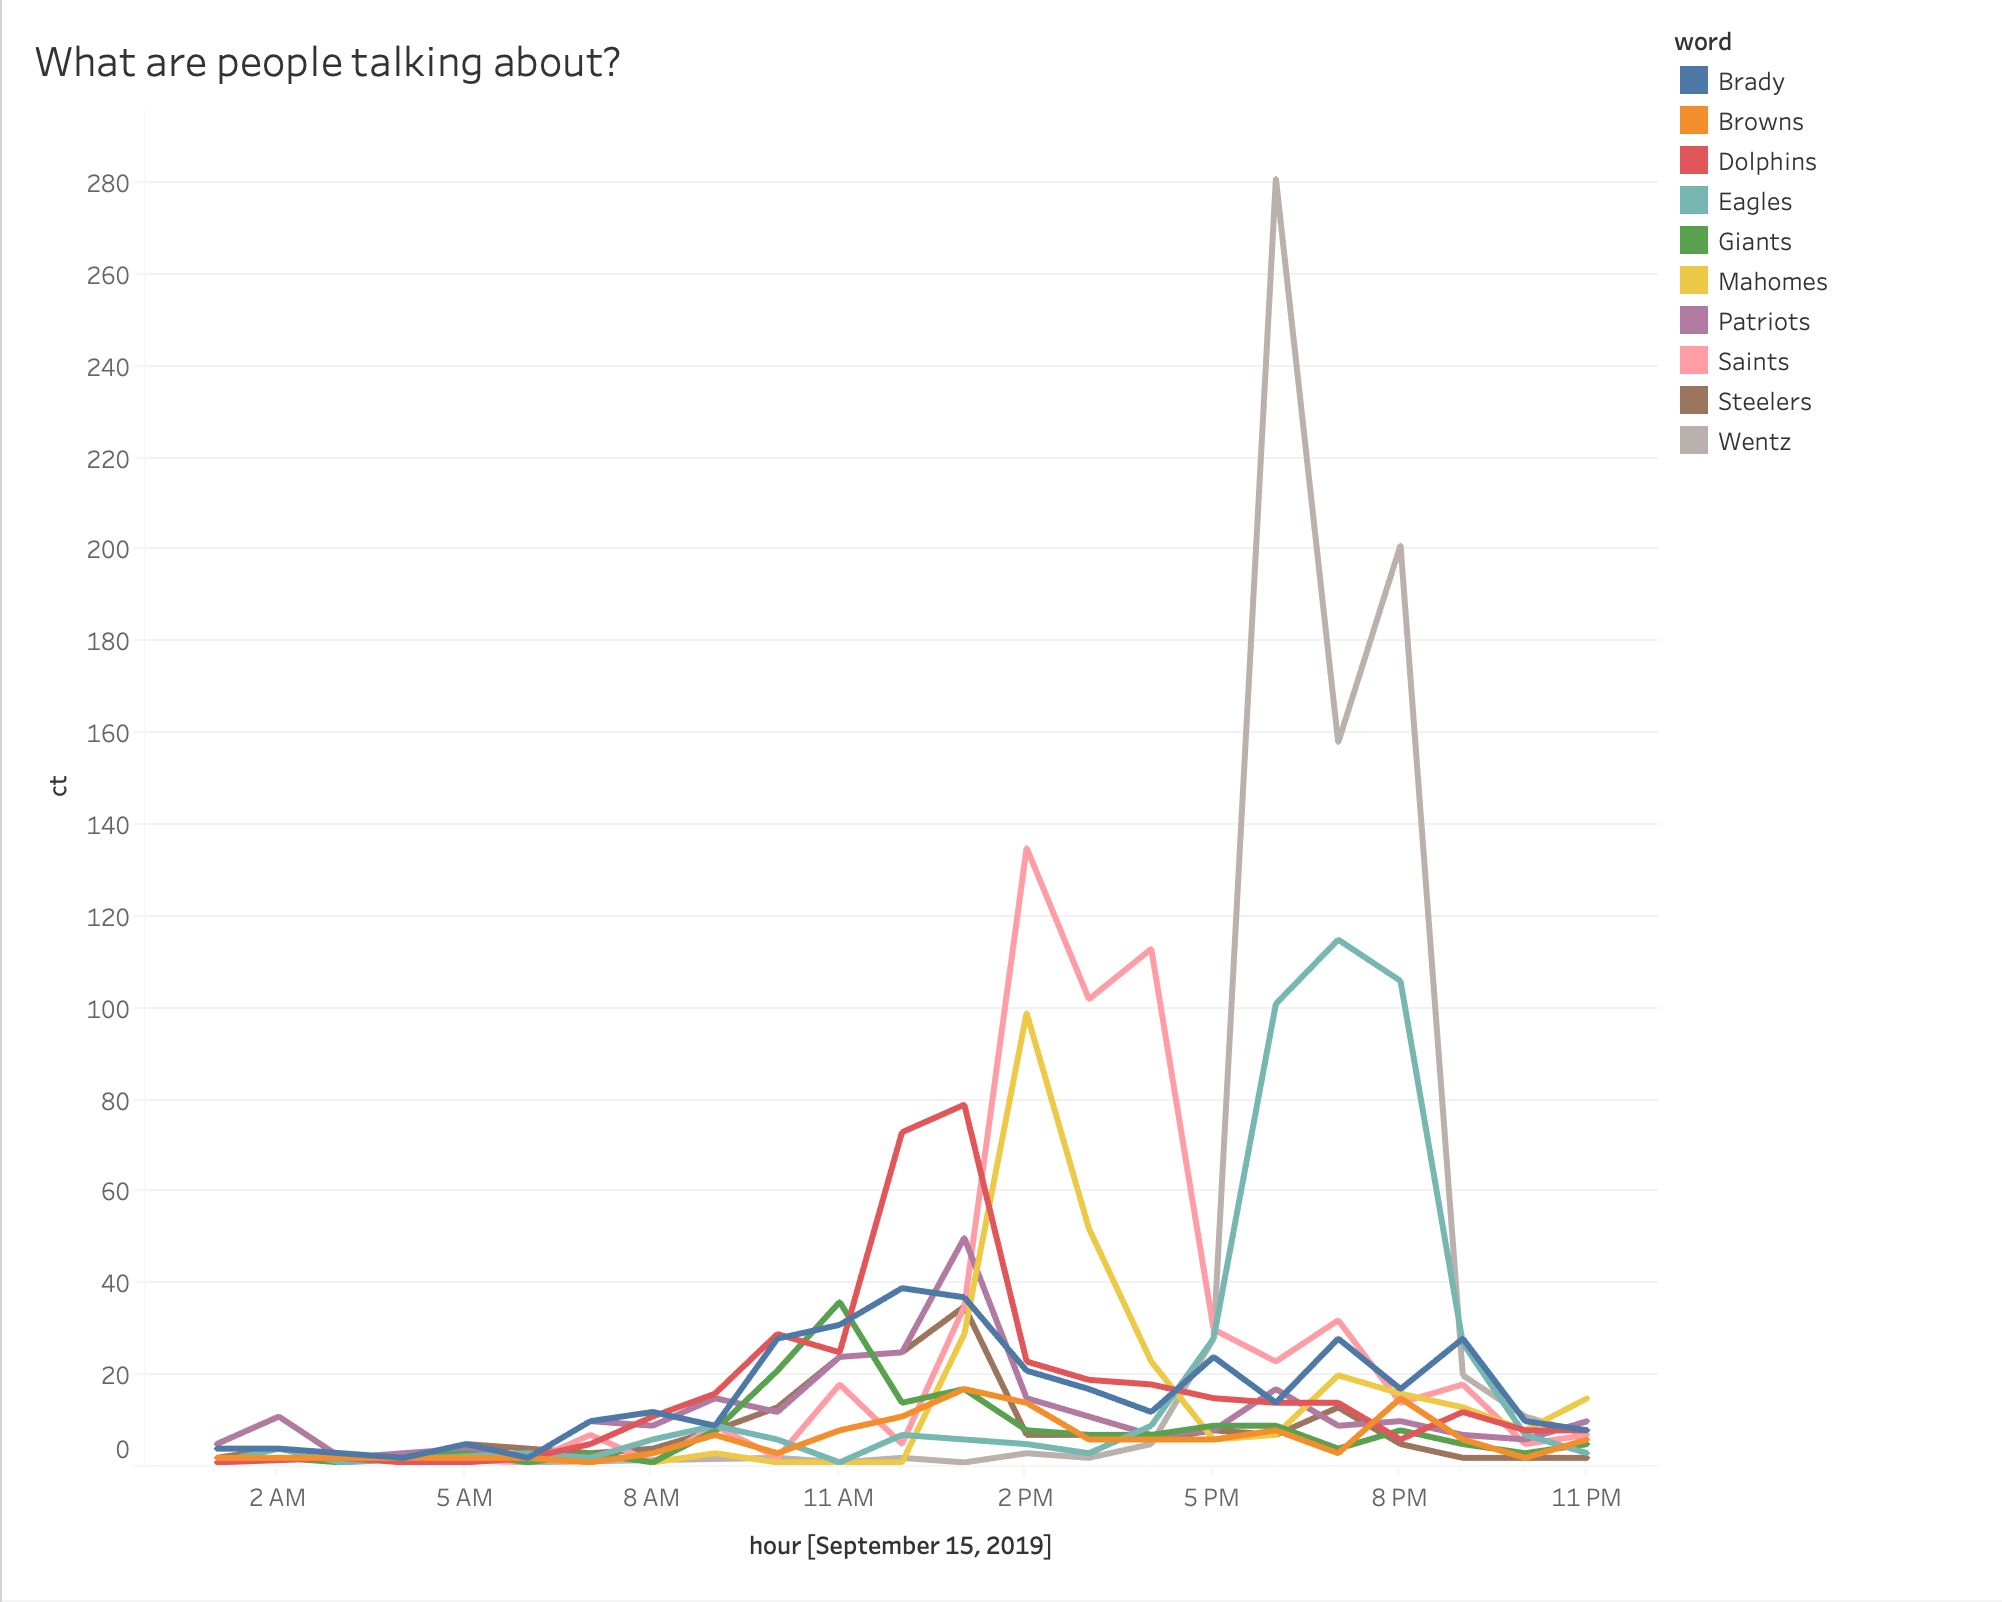
Finally, let’s dig a bit deeper into what exactly had the folks at r/nfl so fired up. We can write a query to find the 10 most frequently occurring player / team names and plot them over time as well. Let’s dig into Sunday in particular:
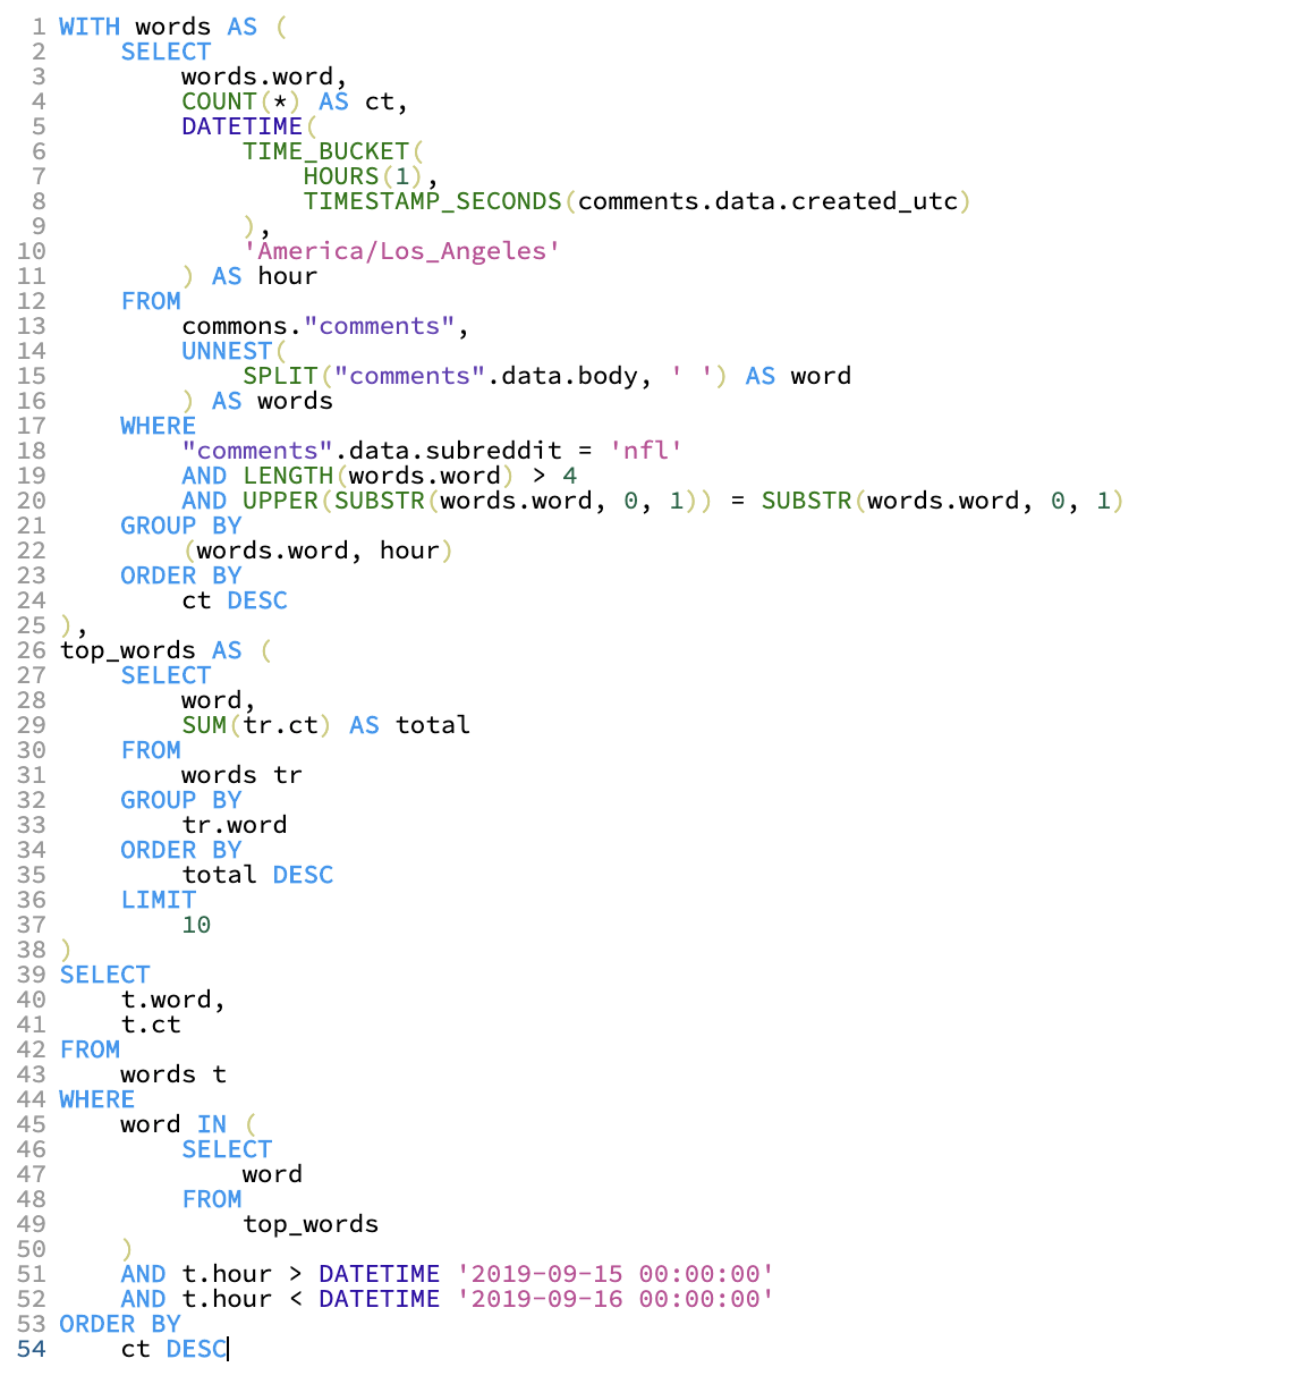
Note that to get this info, we had to split each comment by word and join the unnested resulting array back against the original collection. Not a trivial query!
Again using the Tableau Custom SQL feature, we see that Carson Wentz seems to have the most buzz in Week 2!
Summary
In this blog post, we walked through creating an interactive, live dashboard in Tableau to analyze live streaming data from Kafka. We used Rockset as a data sink for Kafka event data, in order to provide low-latency SQL to serve real-time Tableau dashboards. The steps we followed were:
- Start with data in a Kafka topic.
- Create a collection in Rockset, using the Kafka topic as a source.
- Write one or more SQL queries that return the data needed in Tableau.
- Create a data source in Tableau using custom SQL.
- Use the Tableau interface to create charts and real-time dashboards.
Visit our Kafka solutions page for more information on building real-time dashboards and APIs on Kafka event streams.