How We Reduced DynamoDB Costs by Using DynamoDB Streams and Scans More Efficiently
August 23, 2019
Many of our users implement operational reporting and analytics on DynamoDB using Rockset as a SQL intelligence layer to serve live dashboards and applications. As an engineering team, we are constantly searching for opportunities to improve their SQL-on-DynamoDB experience.
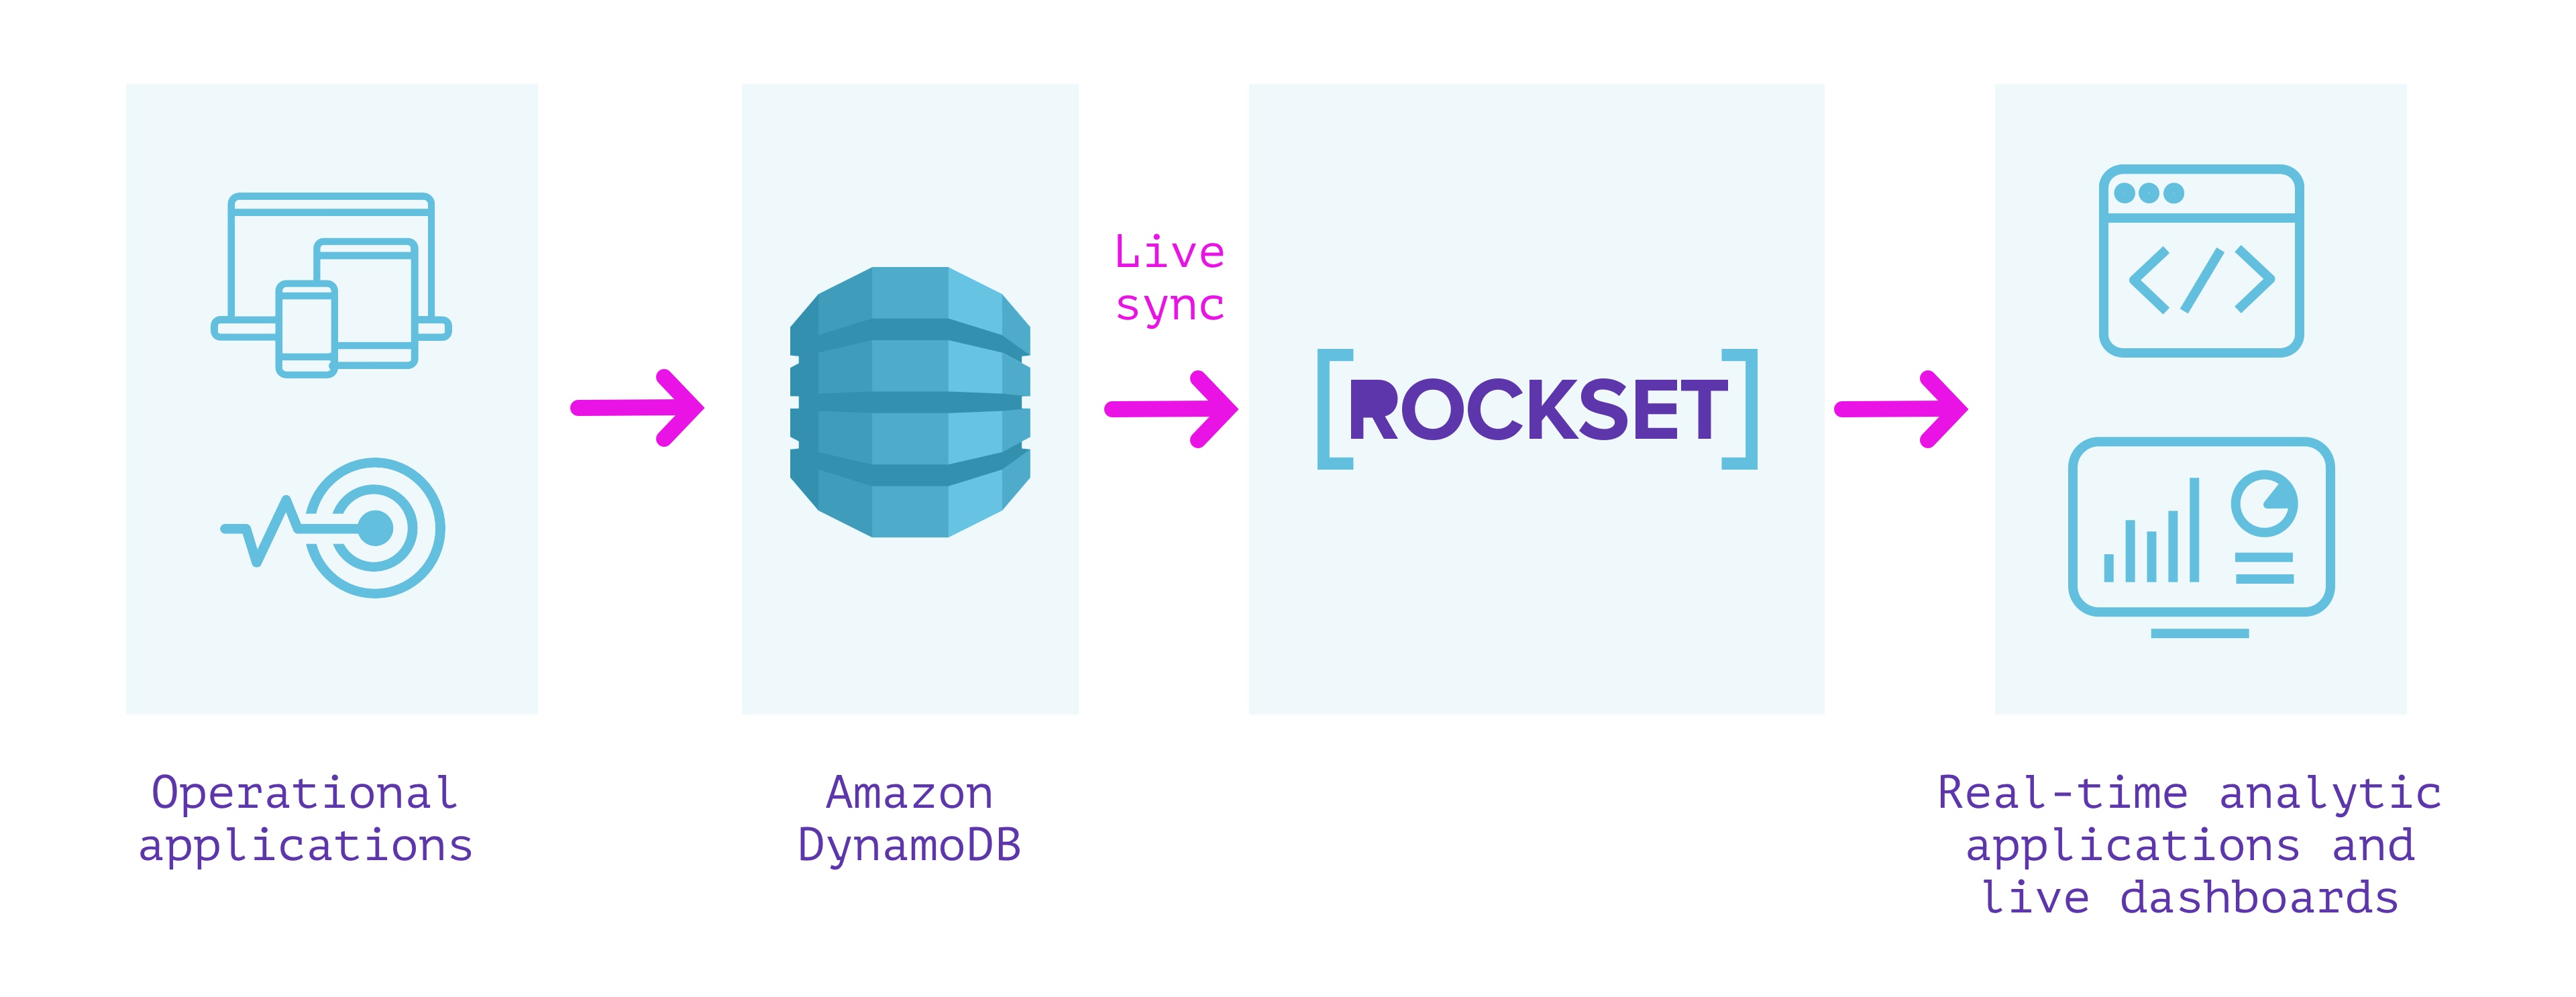
For the past few weeks, we have been hard at work tuning the performance of our DynamoDB ingestion process. The first step in this process was diving into DynamoDB’s documentation and doing some experimentation to ensure that we were using DynamoDB’s read APIs in a way that maximizes both the stability and performance of our system.
Background on DynamoDB APIs
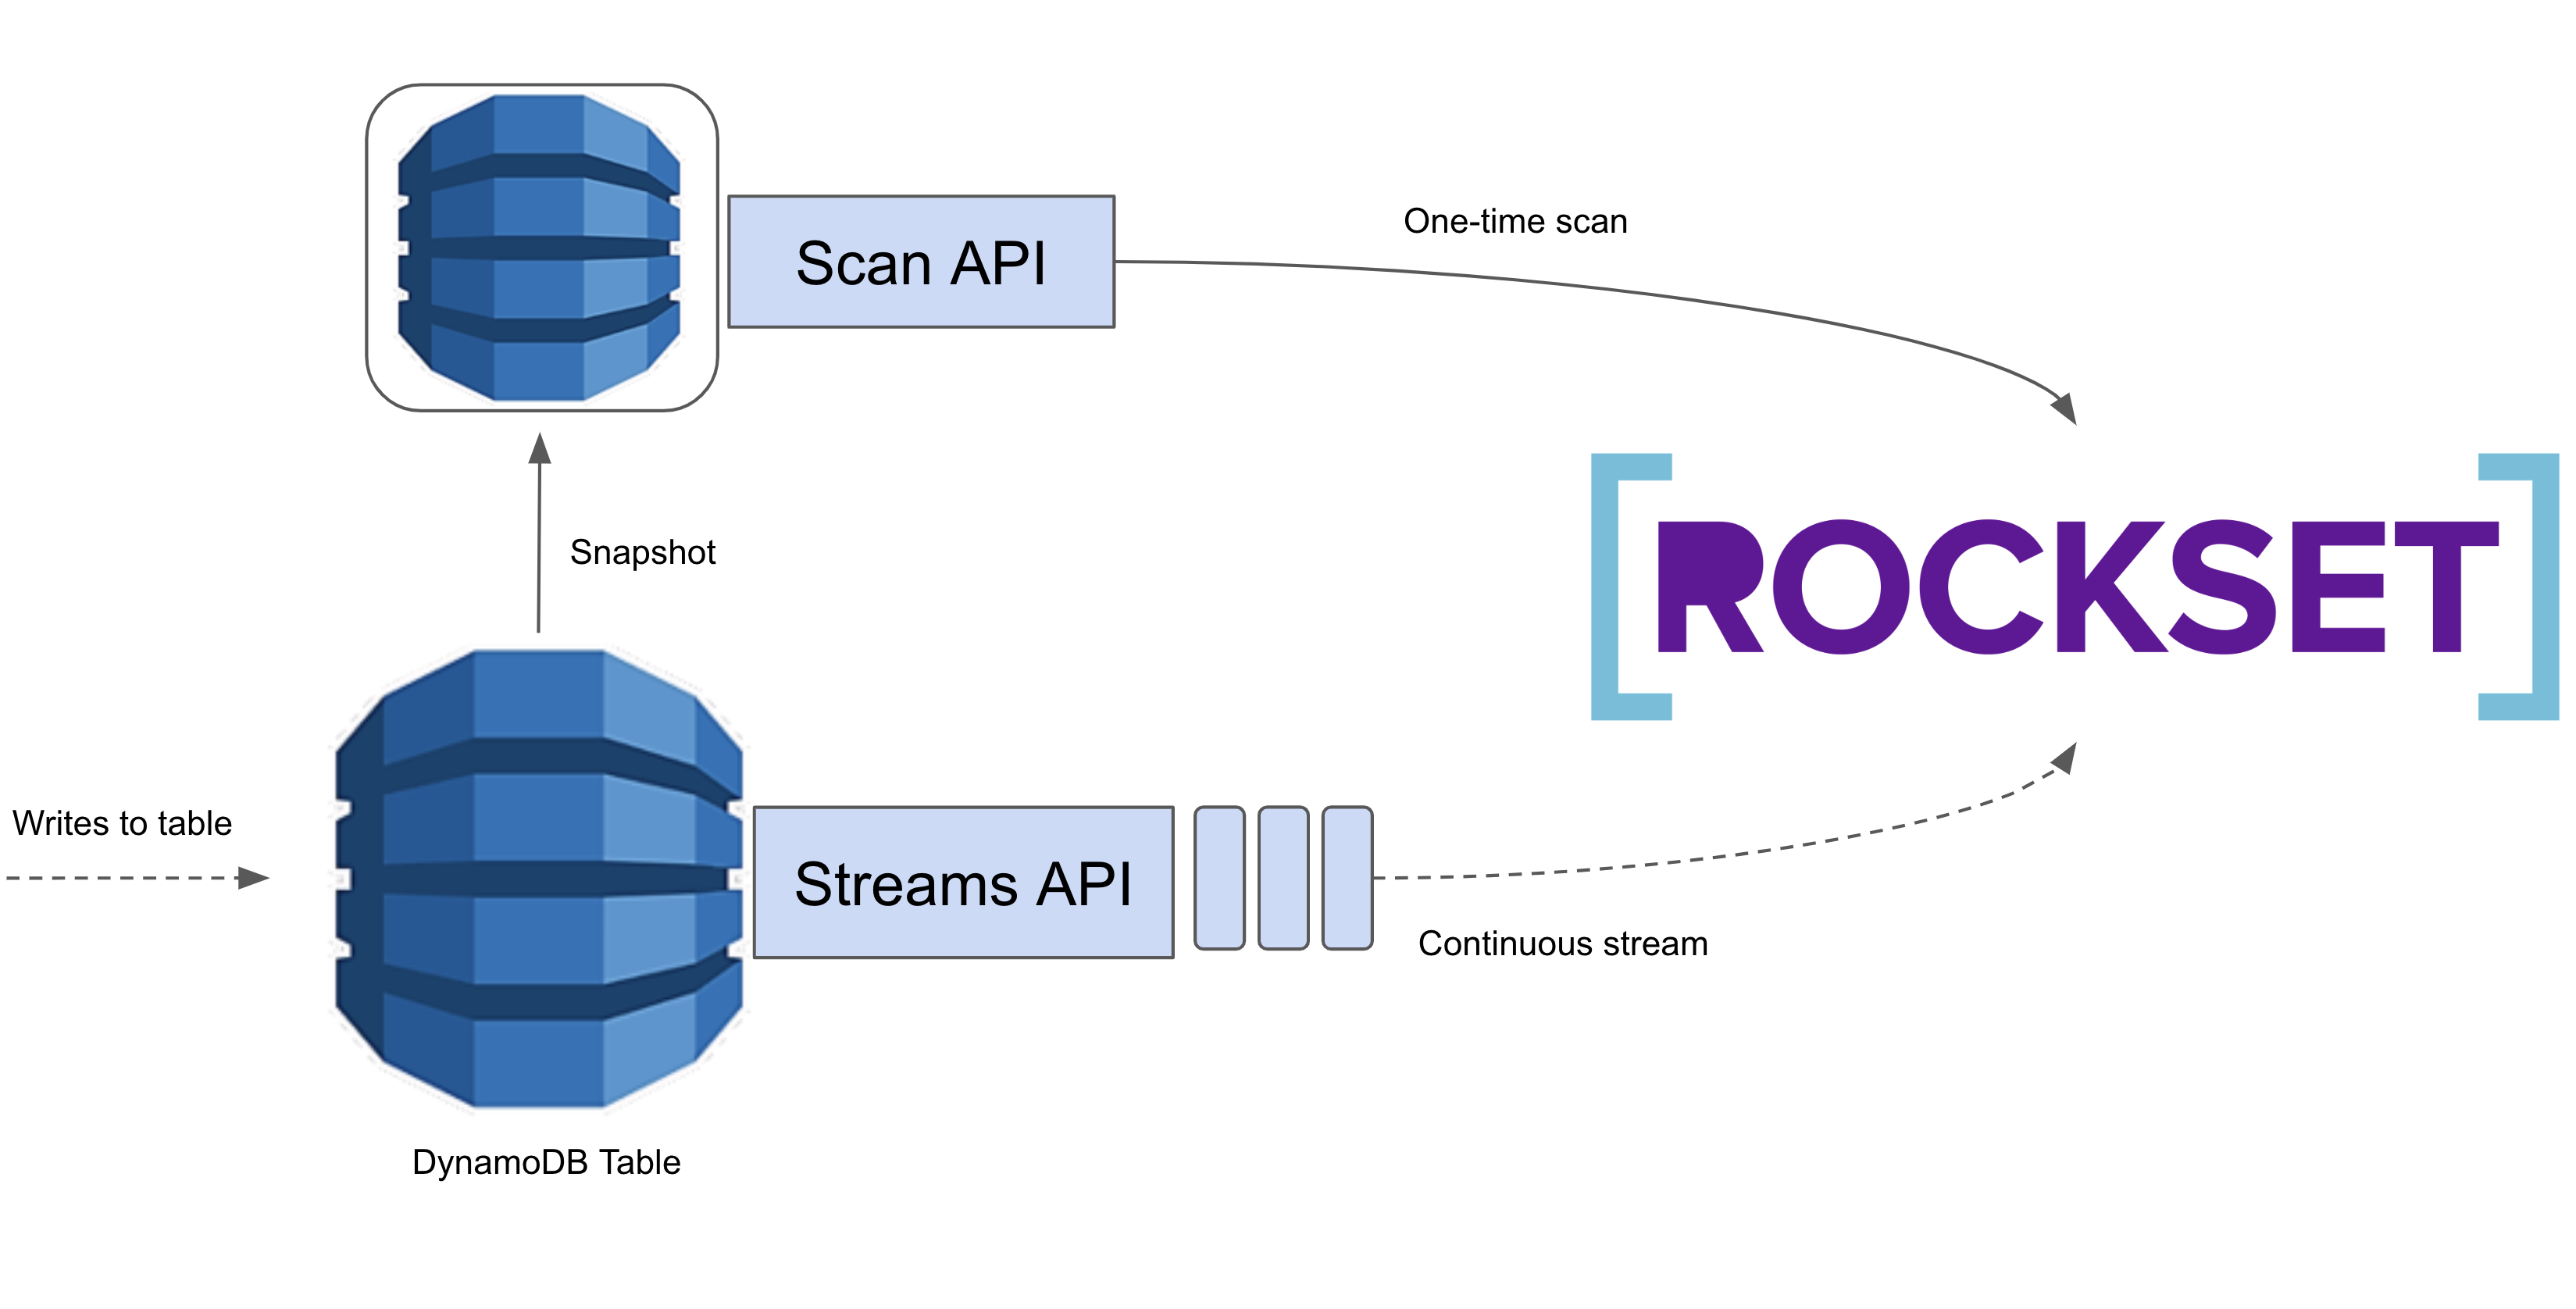
AWS offers a Scan API and a Streams API for reading data from DynamoDB. The Scan API allows us to linearly scan an entire DynamoDB table. This is expensive, but sometimes unavoidable. We use the Scan API the first time we load data from a DynamoDB table to a Rockset collection, as we have no means of gathering all the data other than scanning through it. After this initial load, we only need to monitor for updates, so using the Scan API would be quite wasteful. Instead, we use the Streams API which gives us a time-ordered queue of updates applied to the DynamoDB table. We read these updates and apply them into Rockset, giving users realtime access to their DynamoDB data in Rockset!
Scans
How we measure scan performance
During the scanning phase, we aim to consistently maximize our read throughput from DynamoDB without consuming more than a user-specified number of RCUs per table. We want ingesting data into Rockset to be efficient without interfering with existing workloads running on users’ live DynamoDB tables.
Understanding how to set scan parameters
From very preliminary testing, we noticed that our scanning phase took quite a long time to complete so we did some digging to figure out why. We ingested a DynamoDB table into Rockset and observed what happened during the scanning phase. We expected to consistently consume all of the provisioned throughput.
Initially, our RCU consumption looked like the following:
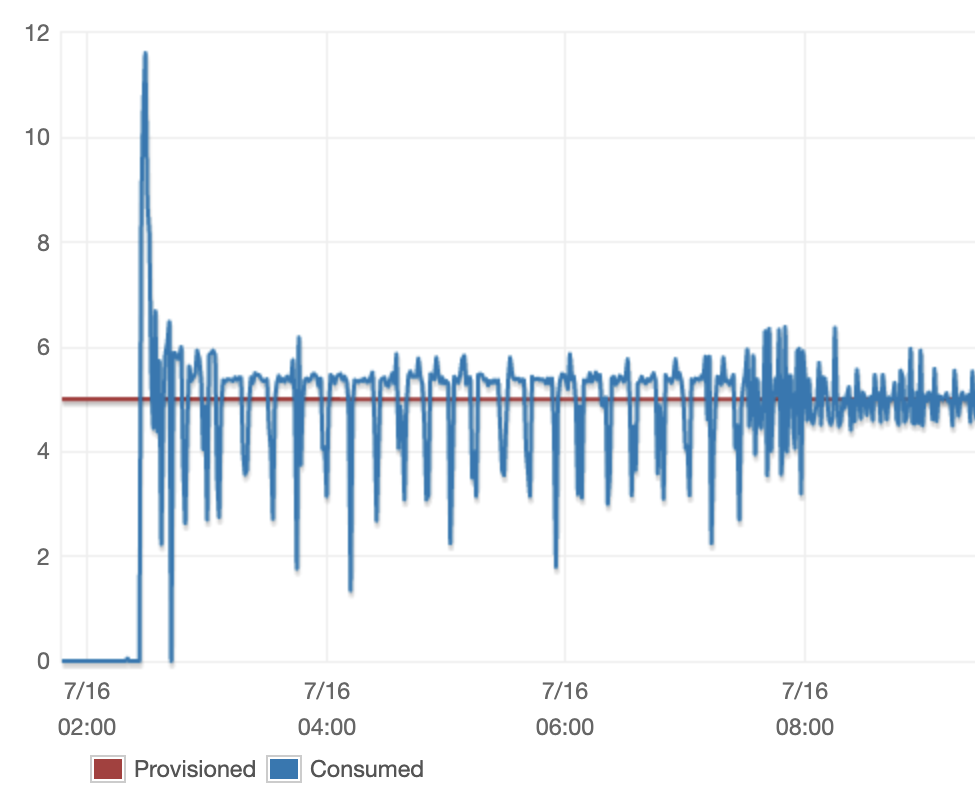
The problem was clear but the underlying cause was not obvious. At the time, there were a few variables that we were controlling quite naively. DynamoDB exposes two important variables: page size and segment count, both of which we had set to fixed values. We also had our own rate limiter which throttled the number of DynamoDB Scan API calls we made. We had also set the limit this rate limiter was enforcing to a fixed value. We suspected that one of these variables being sub-optimally configured was the likely cause of the massive fluctuations we were observing.
Some investigation revealed that the cause of the fluctuation was primarily the rate limiter. It turned out the fixed limit we had set on our rate limiter was too low, so we were getting throttled too aggressively by our own rate limiter. We decided to fix this problem by configuring our limiter based on the amount of RCU allocated to the table. We can easily (and do plan to) transition to using a user-specified number of RCU for each table, which will allow us to limit Rockset’s RCU consumption even when users have RCU autoscaling enabled.
public int getScanRateLimit(AmazonDynamoDB client, String tableName,
                            int numSegments) {
    TableDescription tableDesc = client.describeTable(tableName).getTable();
    // Note: this will return 0 if the table has RCU autoscaling enabled
    final long tableRcu = tableDesc.getProvisionedThroughput().getReadCapacityUnits();
    final int numSegments = config.getNumSegments();
    return desiredRcuUsage / numSegments;
}
For each segment, we perform a scan, consuming capacity on our rate limiter as we consume DynamoDB RCU’s.
public void doScan(AmazonDynamoDb client, String tableName, int numSegments) {
    RateLimiter rateLimiter = RateLimiter.create(getScanRateLimit(client,
                                                 tableName, numSegments))
    while (!done) {
        ScanResult result = client.scan(/* feed scan request in */);
        // do processing ...
        rateLimiter.acquire(result.getConsumedCapacity().getCapacityUnits());
    }
}
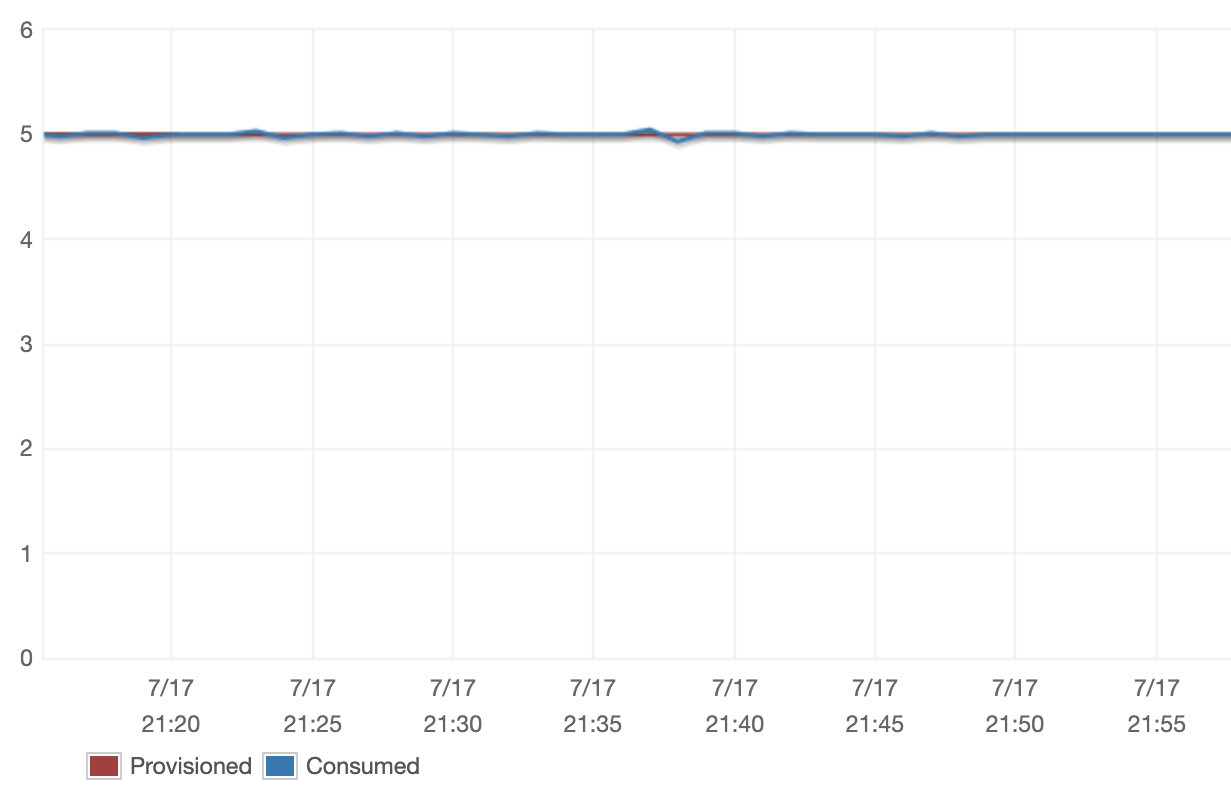
The result of our new Scan configuration was the following:
Streams
How we measure streaming performance
Our goal during the streaming phase of ingestion is to minimize the amount of time it takes for an update to enter Rockset after it is applied in DynamoDB while keeping the cost using Rockset as low as possible for our users. The primary cost factor for DynamoDB Streams is the number of API calls we make. DynamoDB’s pricing allows users 2.5 million free API calls and charges $0.02 per 100,000 requests beyond that. We want to try to stay as close to the free tier as possible.
Previously we were querying DynamoDB at a rate of ~300 requests/second because we encountered a lot of empty shards in the streams we were reading. We believed that we’d need to iterate through all of these empty shards regardless of the rate we were querying at. To mitigate the load we put on users’ Dynamo tables (and in turn their wallets), we set a timer on these reads and then stopped reading for 5 minutes if we didn’t find any new records. Given that this mechanism ended up charging users who didn’t even have much data in DynamoDB and still had a worst case latency of 5 minutes, we started investigating how we could do better.
Reducing the frequency of streaming calls
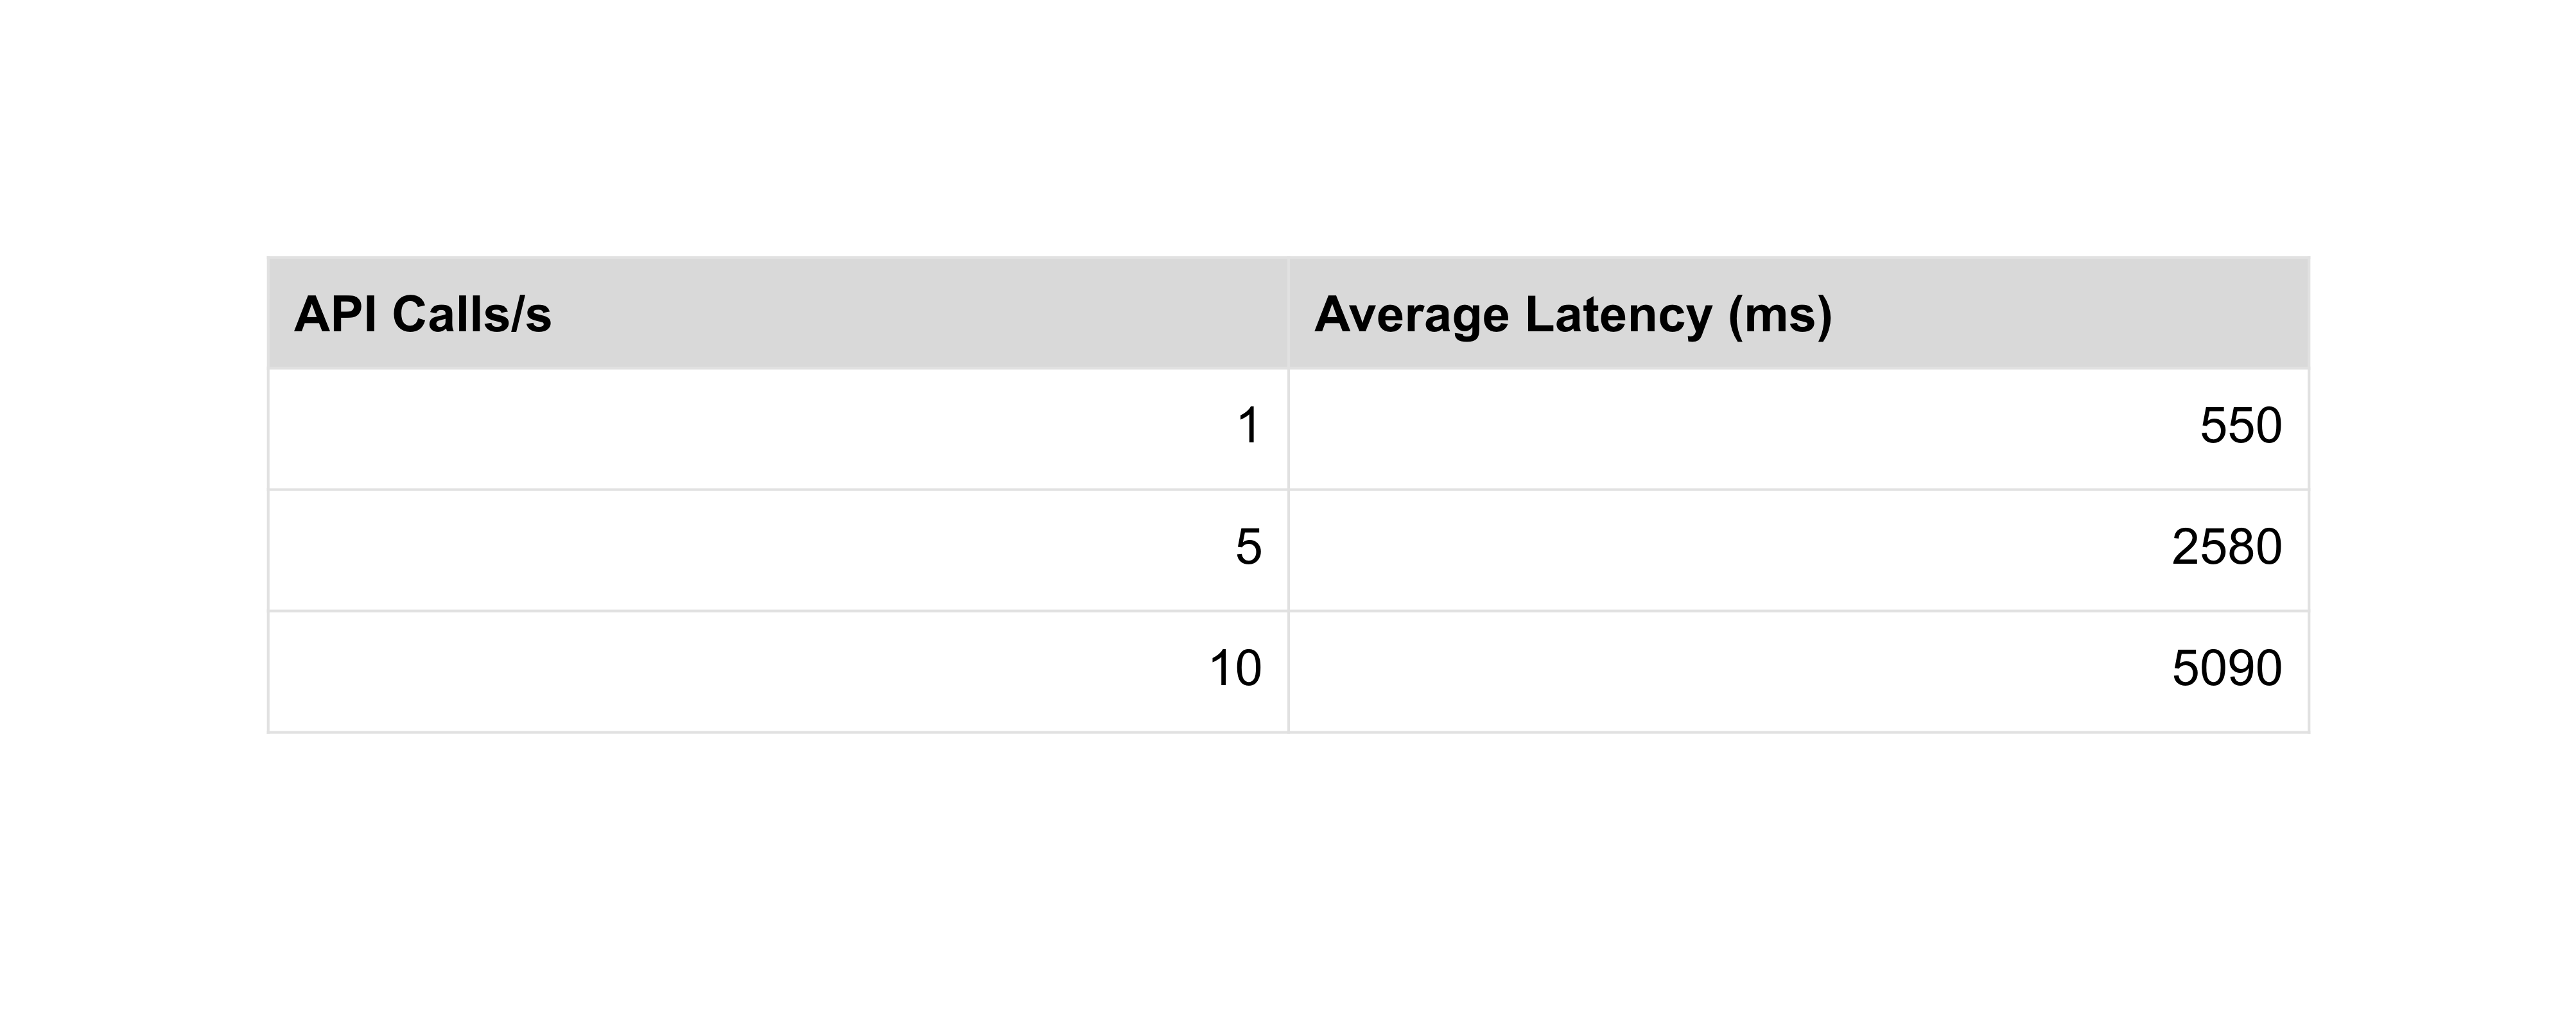
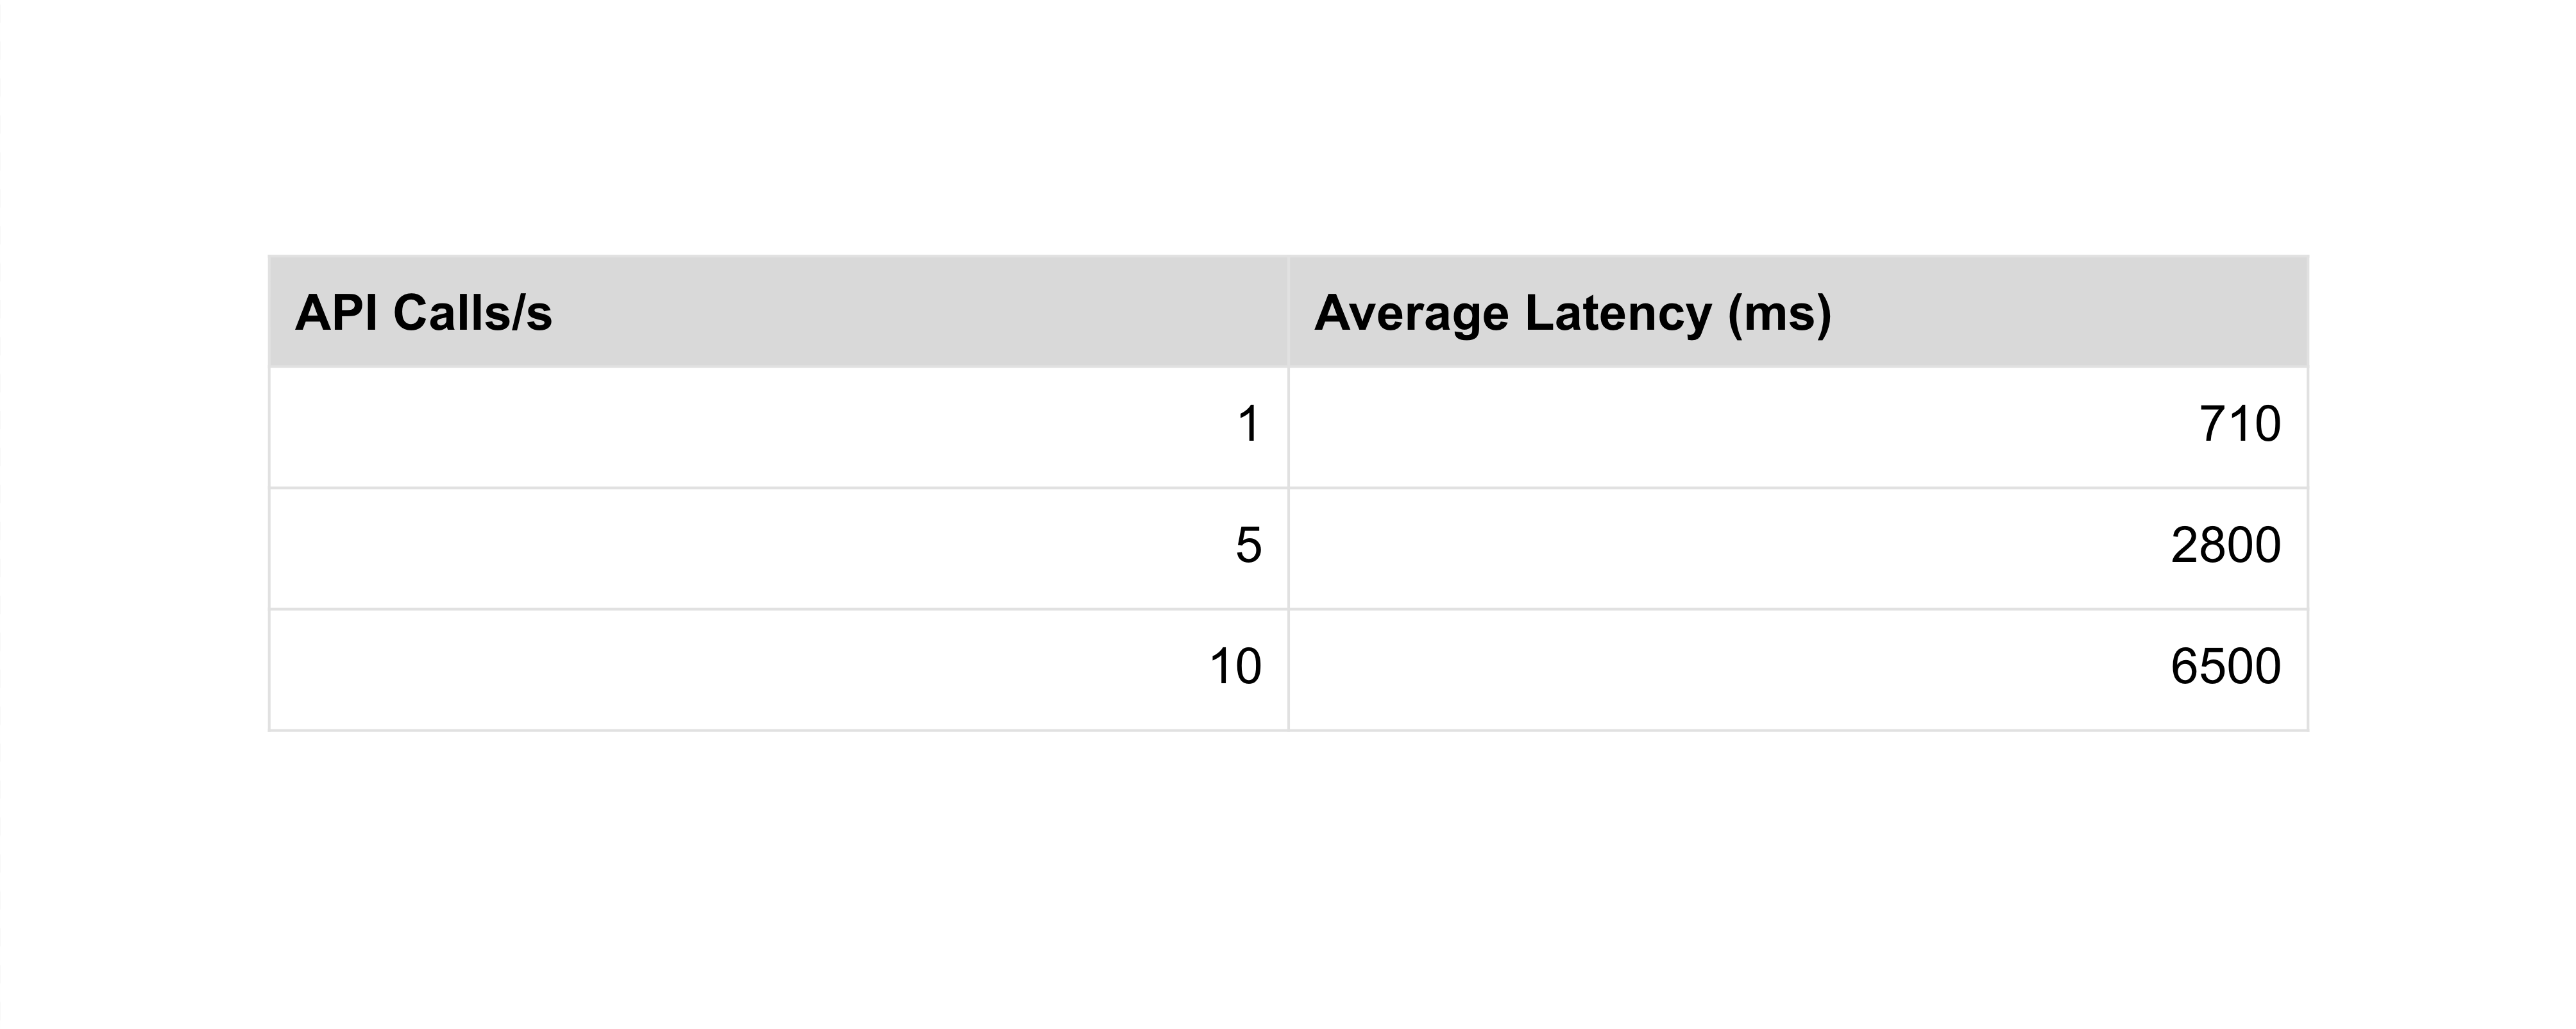
We ran several experiments to clarify our understanding of the DynamoDB Streams API and determine whether we could reduce the frequency of the DynamoDB Streams API calls our users were being charged for. For each experiment, we varied the amount of time we waited between API calls and measured the average amount of time it took for an update to a DynamoDB table to be reflected in Rockset.
Inserting records into the DynamoDB table at a constant rate of 2 records/second, the results were as follows:
Calculating our cost reduction
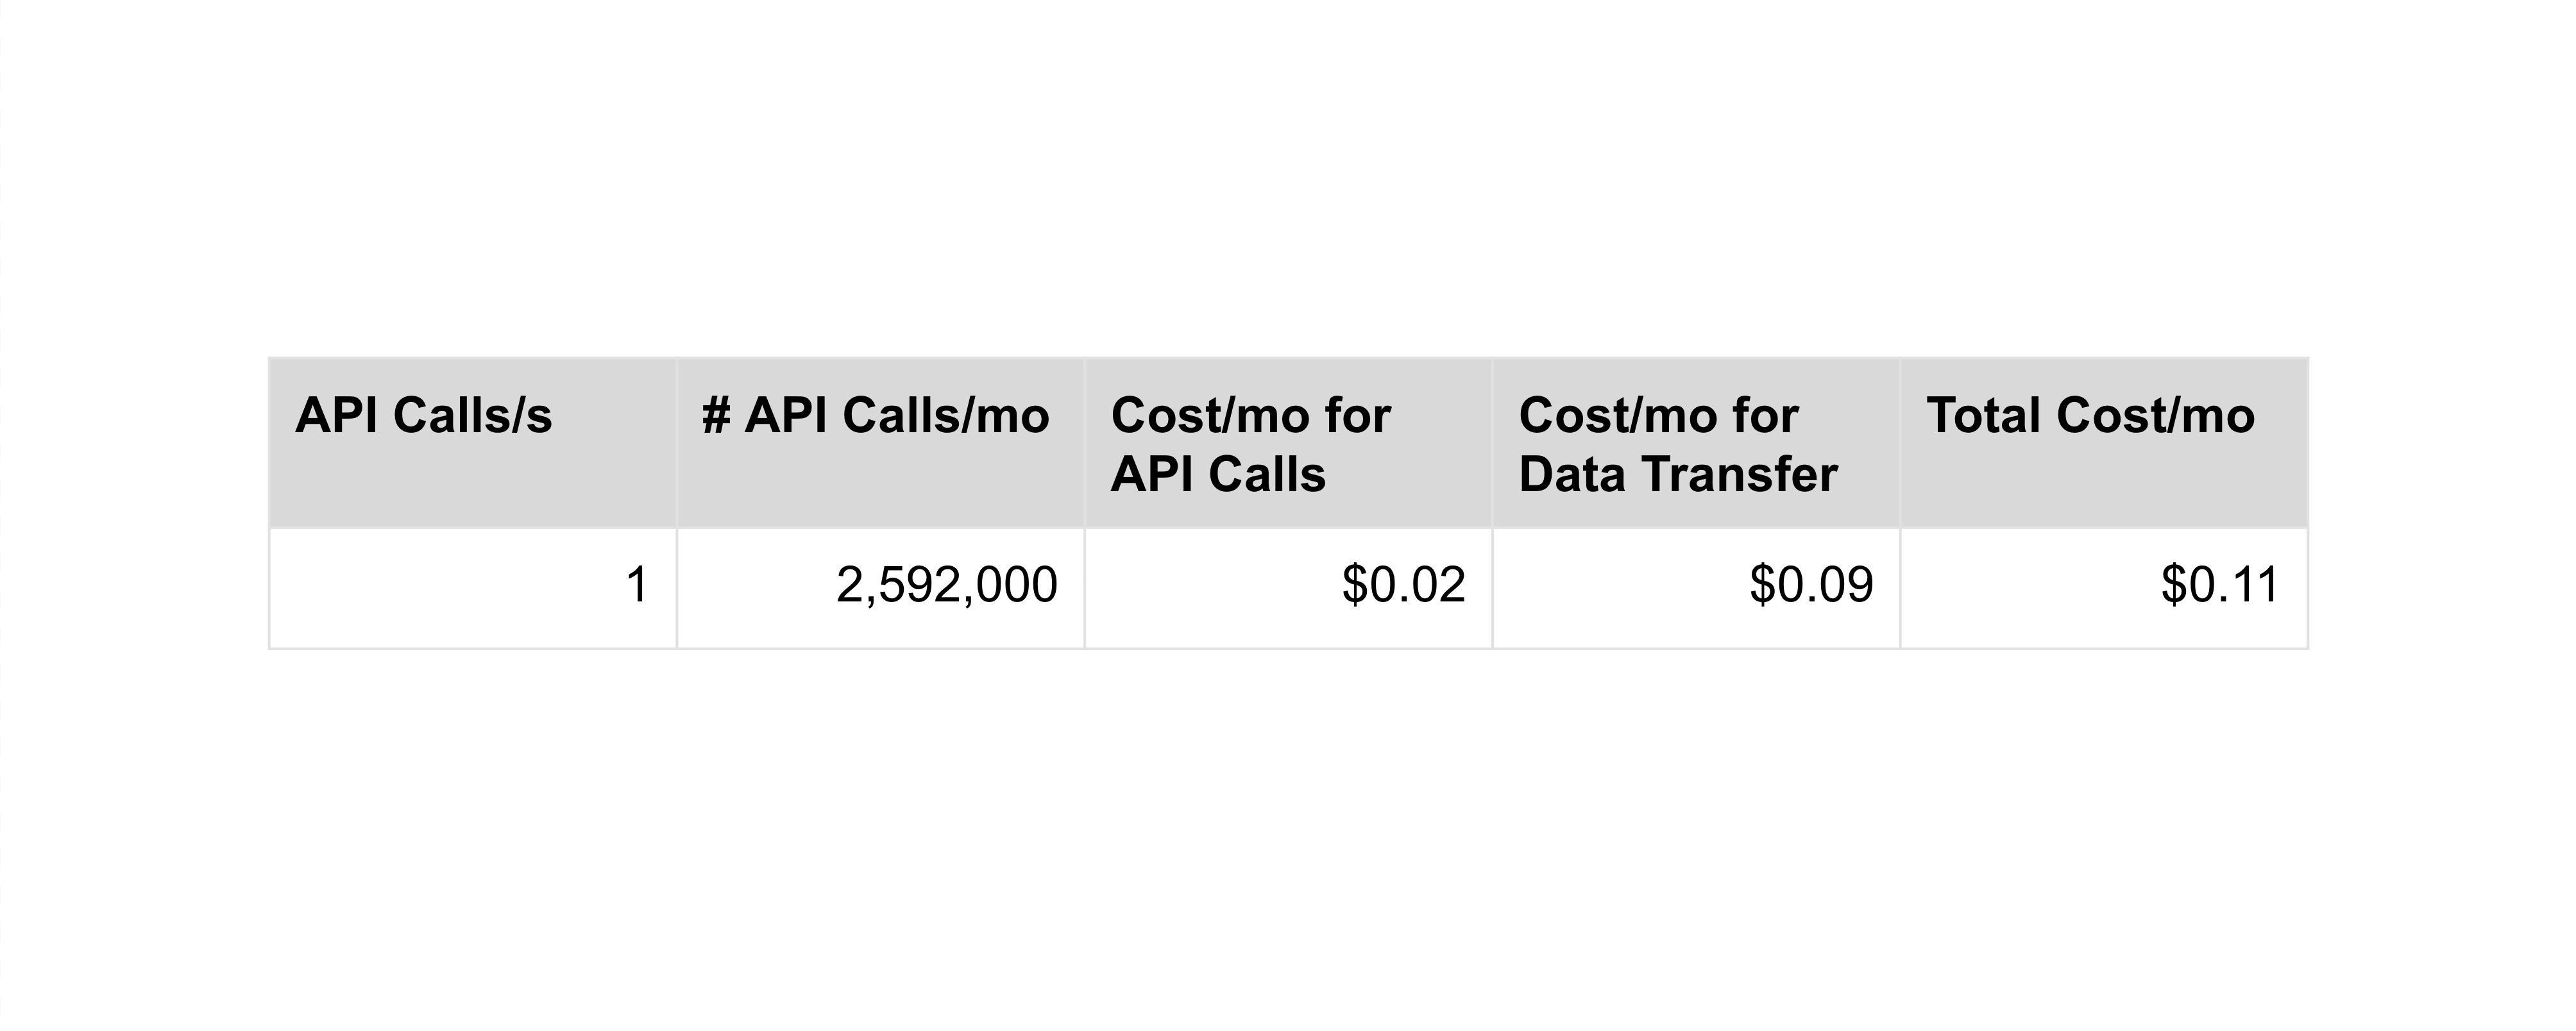
Since with DynamoDB Streams we are directly responsible for our users costs, we decided that we needed to precisely calculate the cost our users incur due to the way we use DynamoDB Streams. There are two factors which wholly determine the amount that users will be charged for DynamoDB Streams: the number of Streams API calls made and the amount of data transferred. The amount of data transferred is largely beyond our control. Each API call response unavoidably transfers a small amount (768 bytes) of data. The rest is all user data, which is only read into Rockset once. We focused on controlling the number of DynamoDB Streams API calls we make to users’ tables as this was previously the driver of our users’ DynamoDB costs.
Following is a breakdown of the cost we estimate with our newly remodeled ingestion process:
Conclusion
We’re really excited that the work we’ve been doing has successfully driven DynamoDB costs down for our users while allowing them to interact with their DynamoDB data in Rockset in realtime!
This is a just sneak peek into some of the challenges and tradeoffs we’ve faced while working to make ingesting data from DynamoDB into Rockset as seamless as possible. If you’re interested in learning more about how to operationalize your DynamoDB data using Rockset check out some of our recent material and stay tuned for updates as we continue to build Rockset out!
If you'd like to see Rockset and DynamoDB in action, you should check out our brief product tour.
Other DynamoDB resources:
- Running Fast SQL on DynamoDB Tables
- Analytics on DynamoDB: Comparing Athena, Spark and Elastic
- Real-Time Analytics on DynamoDB - Using DynamoDB Streams with Lambda and ElastiCache
- Tableau Operational Dashboards and Reporting on DynamoDB - Evaluating Redshift and Athena
- Using Tableau with DynamoDB: How to Build a Real-Time SQL Dashboard on NoSQL Data