Real-Time Clinical Trial Monitoring at Clinical ink
June 12, 2023
Clinical ink is a suite of software used in over a thousand clinical trials to streamline the data collection and management process, with the goal of improving the efficiency and accuracy of trials. Its cloud-based electronic data capture system enables clinical trial data from more than 2 million patients across 110 countries to be collected electronically in real-time from a variety of sources, including electronic health records and wearable devices.
With the COVID-19 pandemic forcing many clinical trials to go virtual, Clinical ink has been an increasingly valuable solution for its ability to support remote monitoring and virtual clinical trials. Rather than require trial participants to come onsite to report patient outcomes they can shift their monitoring to the home. As a result, trials take less time to design, develop and deploy and patient enrollment and retention increases.
To effectively analyze data from clinical trials in the new remote-first environment, clinical trial sponsors came to Clinical ink with the requirement for a real-time 360-degree view of patients and their outcomes across the entire global study. With a centralized real-time analytics dashboard equipped with filter capabilities, clinical teams can take immediate action on patient questions and reviews to ensure the success of the trial. The 360-degree view was designed to be the data epicenter for clinical teams, providing a birds-eye view and robust drill down capabilities so clinical teams could keep trials on track across all geographies.
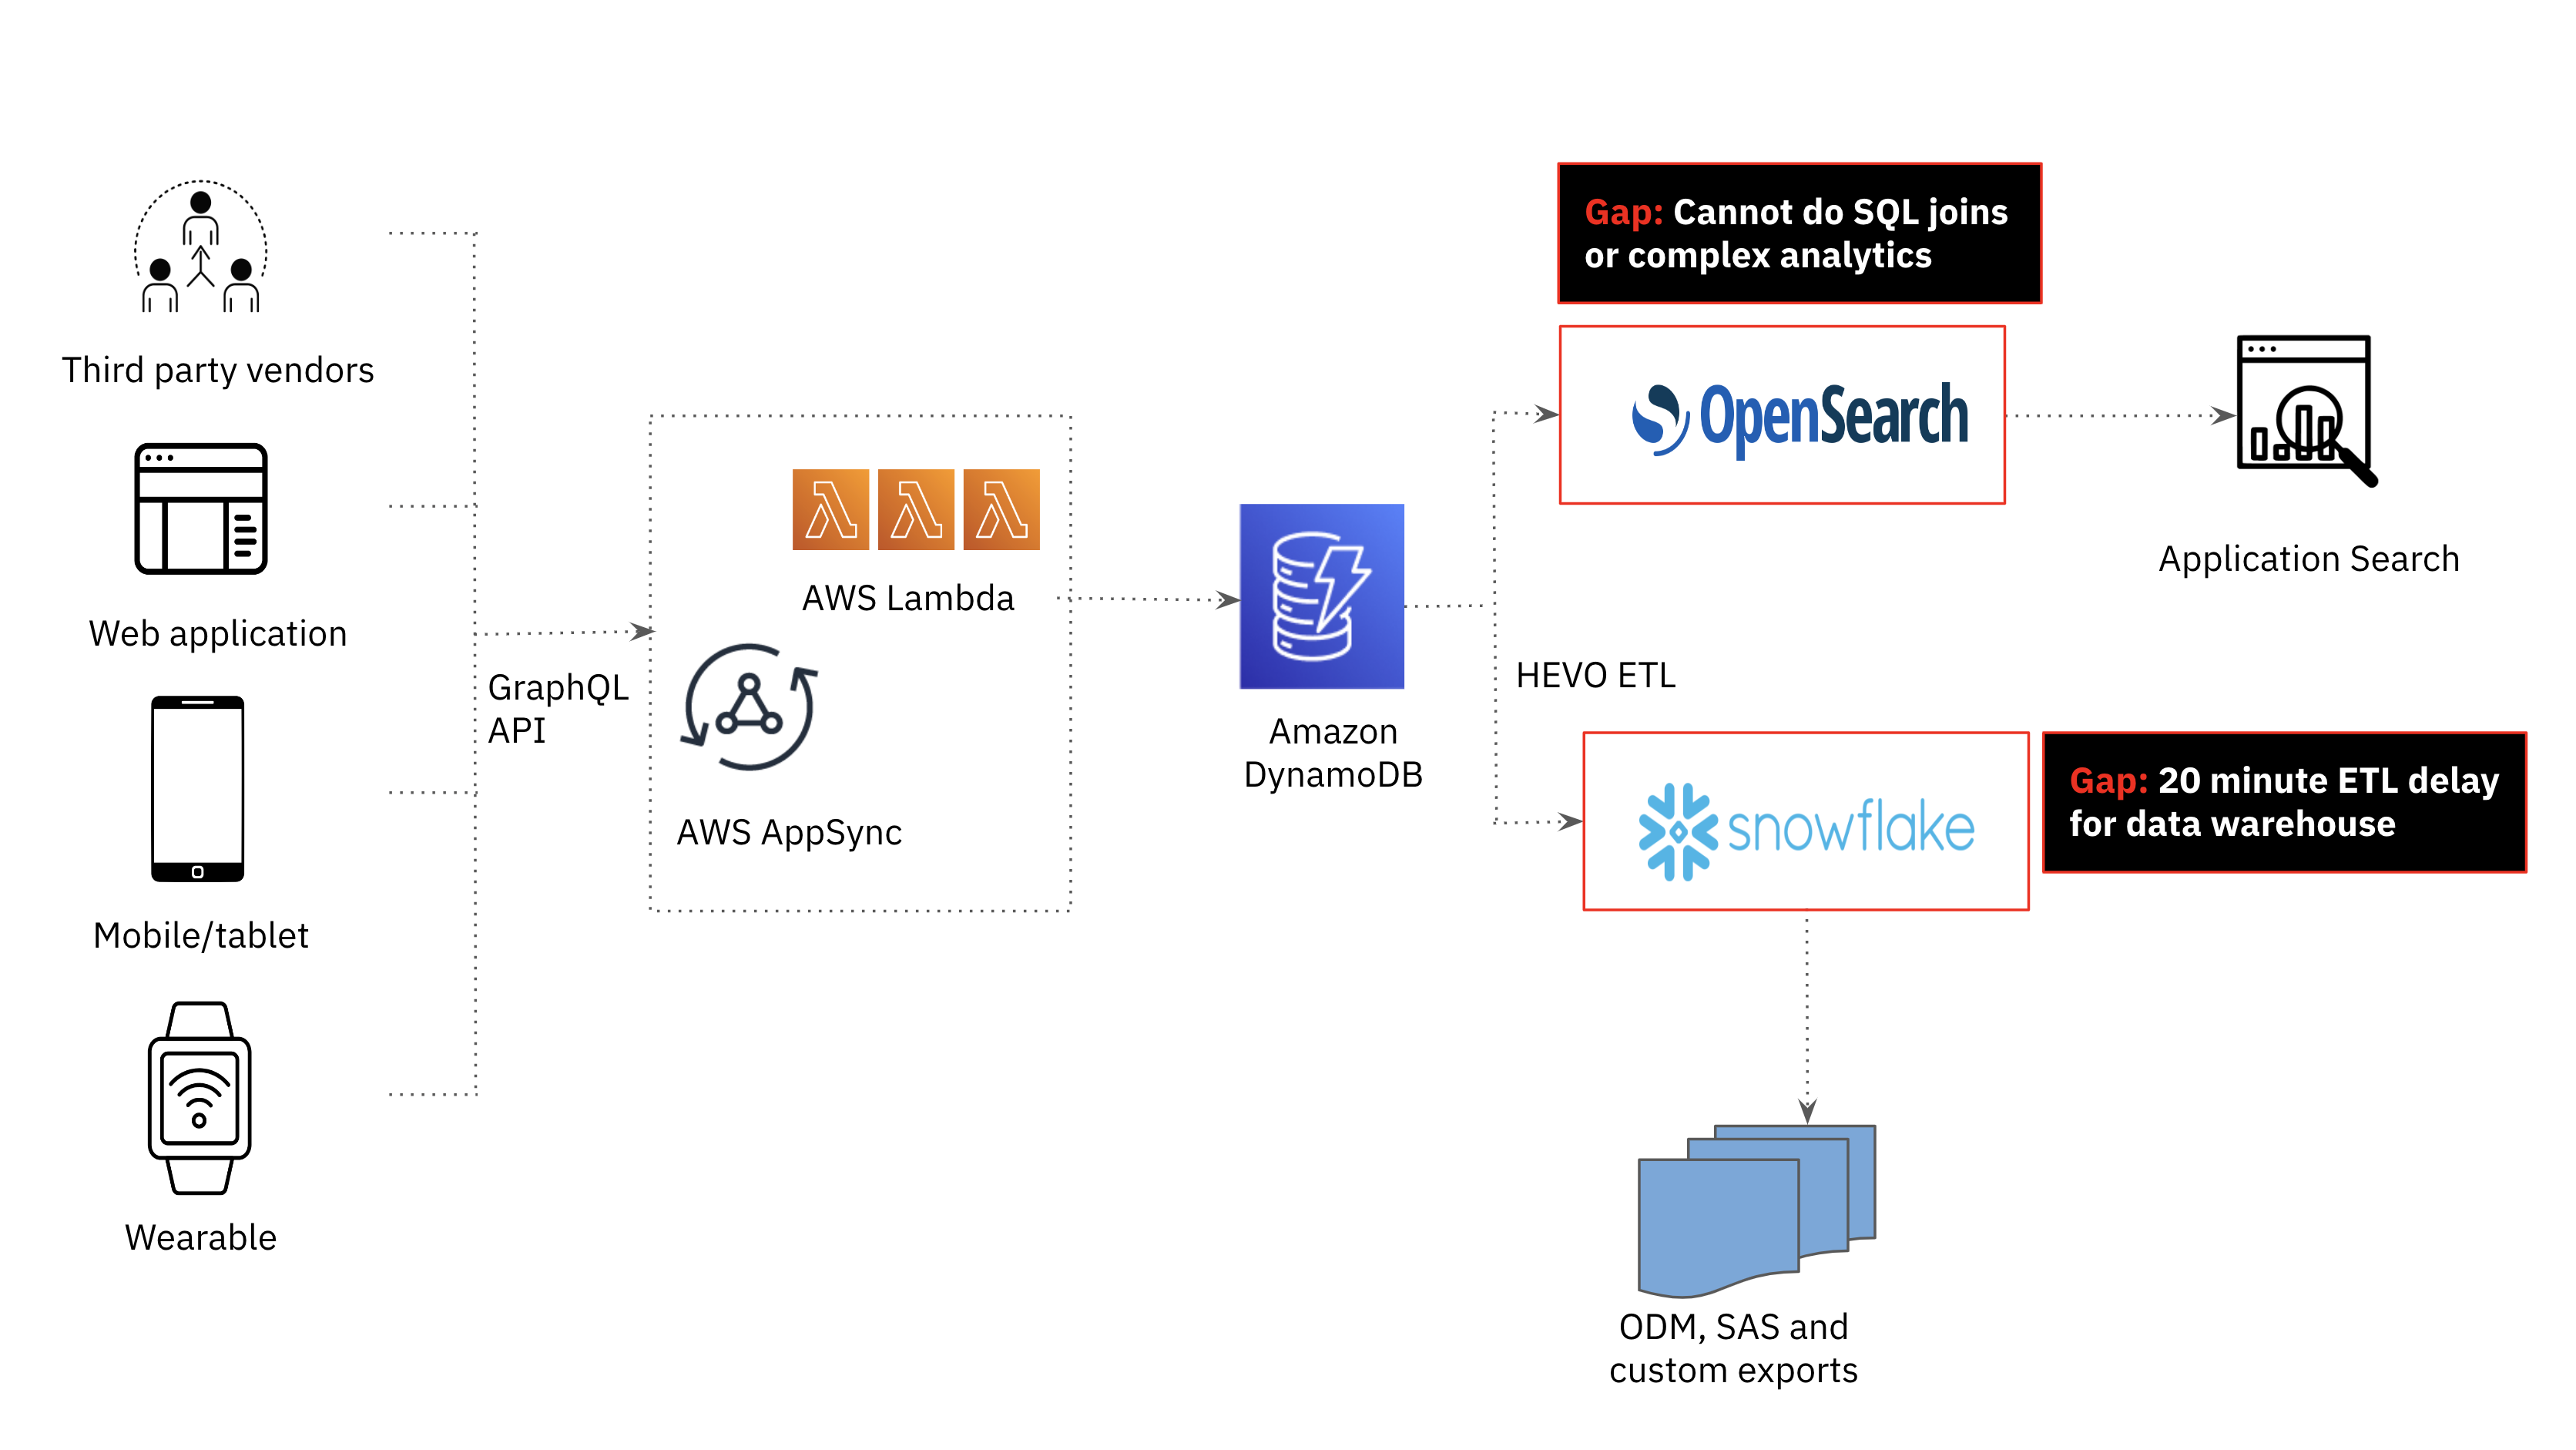
When the requirements for the new real-time study participant monitoring came to the engineering team, I knew that the current technical stack could not support millisecond-latency complex analytics on real-time data. Amazon OpenSearch, a fork of Elasticsearch used for our application search, was fast but not purpose-built for complex analytics including joins. Snowflake, the robust cloud data warehouse used by our analyst team for performant business intelligence workloads, saw significant data delays and could not meet the performance requirements of the application. This sent us to the drawing board to come up with a new architecture; one that supports real-time ingest and complex analytics while being resilient.
The Before Architecture
Amazon DynamoDB for Operational Workloads
In the Clinical ink platform, third party vendor data, web applications, mobile devices and wearable device data is stored in Amazon DynamoDB. Amazon DynamoDB’s flexible schema makes it easy to store and retrieve data in a variety of formats, which is particularly useful for Clinical ink’s application that requires handling dynamic, semi-structured data. DynamoDB is a serverless database so the team did not have to worry about the underlying infrastructure or scaling of the database as these are all managed by AWS.
Amazon Opensearch for Search Workloads
While DynamoDB is a great choice for fast, scalable and highly available transactional workloads, it is not the best for search and analytics use cases. In the first generation Clinical ink platform, search and analytics was offloaded from DynamoDB to Amazon OpenSearch. As the amount and variety of data increased, we realized the need for joins to support more advanced analytics and provide real-time study patient monitoring. Joins are not a first class citizen in OpenSearch, requiring a number of operationally complex and costly workarounds including data denormalization, parent-child relationships, nested objects and application-side joins that are challenging to scale.
We also encountered data and infrastructure operational challenges when scaling OpenSearch. One data challenge we faced centered on dynamic mapping in OpenSearch or the process of automatically detecting and mapping the data types of fields in a document. Dynamic mapping was useful as we had a large number of fields with varying data types and were indexing data from multiple sources with different schemas. However, dynamic mapping sometimes led to unexpected results, such as incorrect data types or mapping conflicts that forced us to reindex the data.
On the infrastructure side, even though we used managed Amazon Opensearch, we were still responsible for cluster operations including managing nodes, shards and indexes. We found that as the size of the documents increased we needed to scale up the cluster which is a manual, time-consuming process. Furthermore, as OpenSearch has a tightly coupled architecture with compute and storage scaling together, we had to overprovision compute resources to support the growing number of documents. This led to compute wastage and higher costs and reduced efficiency. Even if we could have made complex analytics work on OpenSearch, we would have evaluated additional databases as the data engineering and operational management was significant.
Snowflake for Data Warehousing Workloads
We also investigated the potential of our cloud data warehouse, Snowflake, to be the serving layer for analytics in our application. Snowflake was used to provide weekly consolidated reports to clinical trial sponsors and supported SQL analytics, meeting the complex analytics requirements of the application. That said, offloading DynamoDB data to Snowflake was too delayed; at a minimum, we could achieve a 20 minute data latency which fell outside the time window required for this use case.
Requirements
Given the gaps in the current architecture, we came up with the following requirements for the replacement of OpenSearch as the serving layer:
- Real-time streaming ingest: Data changes from DynamoDB need to be visible and queryable in the downstream database within seconds
- Millisecond-latency complex analytics (including joins): The database must be able to consolidate global trial data on patients into a 360-degree view. This includes supporting complex sorting and filtering of the data and aggregations of thousands of different entities.
- Highly Resilient: The database is designed to maintain availability and minimize data loss in the face of various types of failures and disruptions.
- Scalable: The database is cloud-native and can scale at the click of a button or an API call with no downtime. We had invested in a serverless architecture with Amazon DynamoDB and did not want the engineering team to manage cluster-level operations moving forward.
The After Architecture
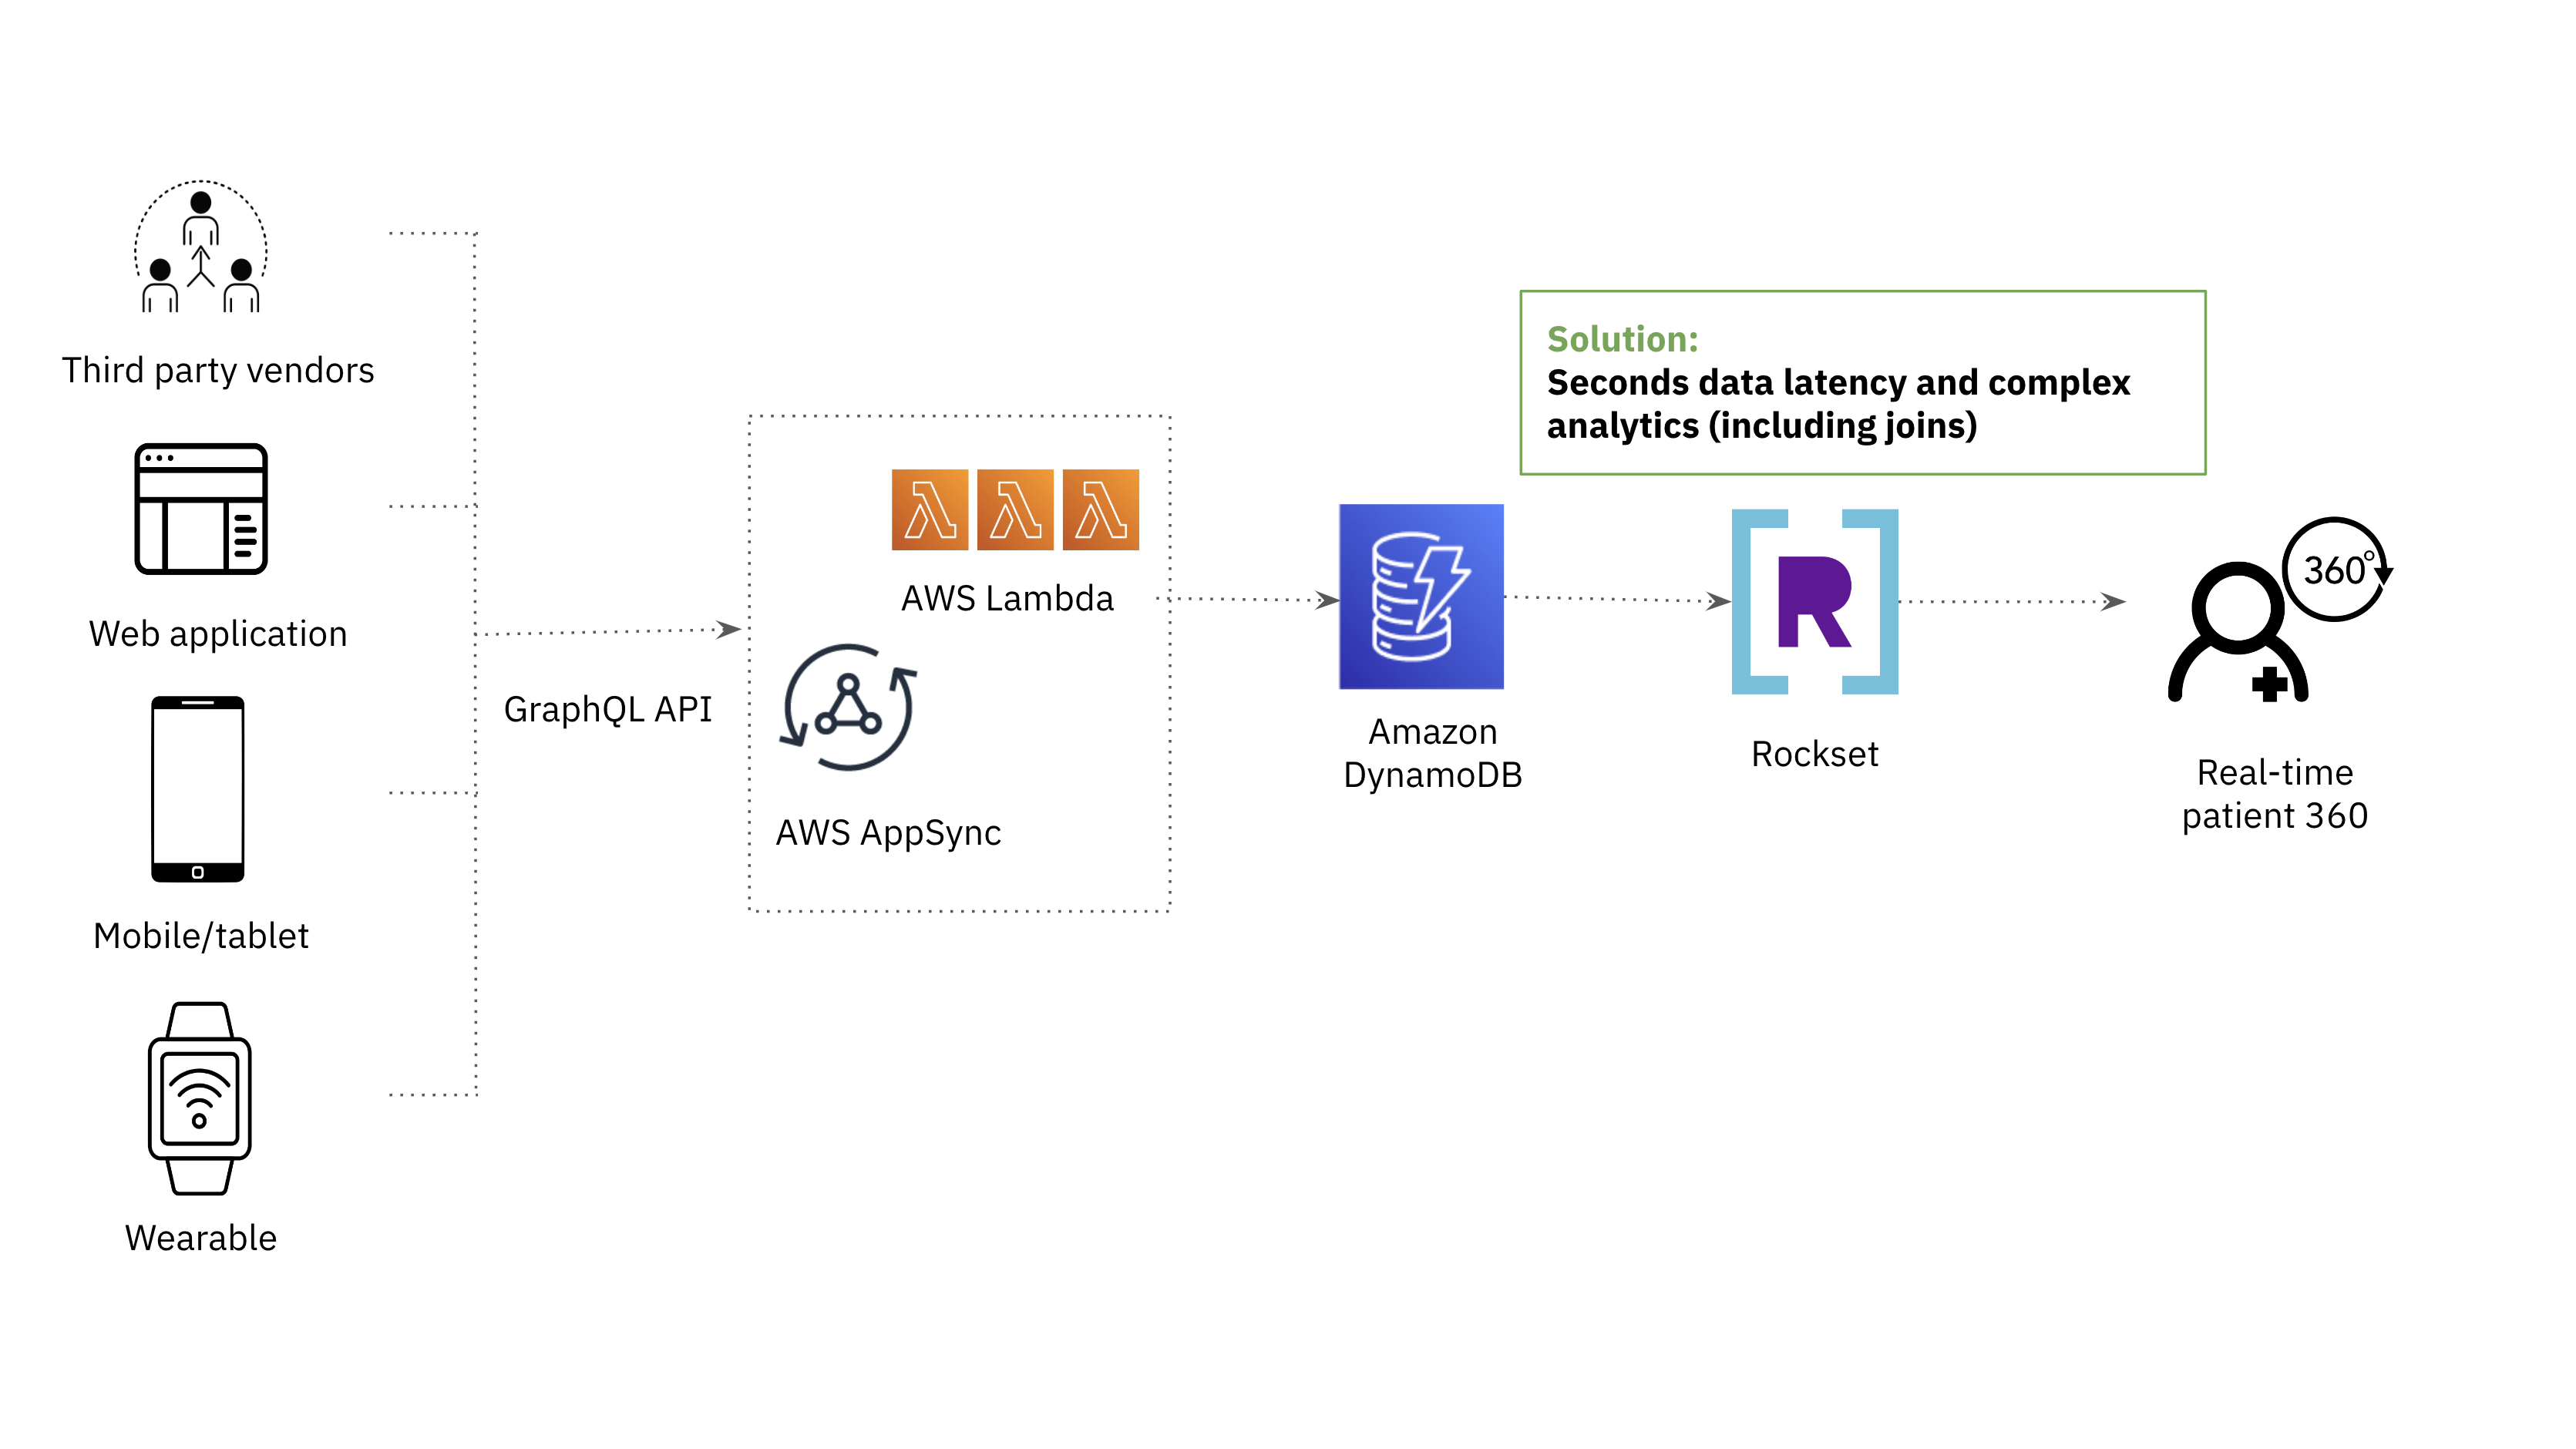
Rockset originally came on our radar as a replacement for OpenSearch for its support of complex analytics on low latency data.
Both OpenSearch and Rockset use indexing to enable fast querying over large amounts of data. The difference is that Rockset employs a Converged Index which is a combination of a search index, columnar store and row store for optimal query performance. The Converged Index supports a SQL-based query language, which enables us to meet the requirement for complex analytics.
In addition to Converged Indexing, there were other features that piqued our interest and made it easy to start performance testing Rockset on our own data and queries.
- Built-in connector to DynamoDB: New data from our DynamoDB tables are reflected and made queryable in Rockset with only a few seconds delay. This made it easy for Rockset to fit into our existing data stack.
- Ability to take multiple data types into the same field: This addressed the data engineering challenges that we faced with dynamic mapping in OpenSearch, ensuring that there were no breakdowns in our ETL process and that queries continued to deliver responses even when there were schema changes.
- Cloud-native architecture: We have also invested in a serverless data stack for resource-efficiency and reduced operational overhead. We were able to scale ingest compute, query compute and storage independently with Rockset so that we no longer need to overprovision resources.
Performance Results
Once we determined that Rockset fulfilled the needs of our application, we proceeded to assess the database's ingestion and query performance. We ran the following tests on Rockset by building a Lambda function with Node.js:
Ingest Performance
The common pattern we see is a lot of small writes, ranging in size from 400 bytes to 2 kilobytes, grouped together and being written to the database frequently. We evaluated ingest performance by generating X writes into DynamoDB in quick succession and recording the average time in milliseconds that it took for Rockset to sync that data and make it queryable, also known as data latency.
To run this performance test, we used a Rockset medium virtual instance with 8 vCPU of compute and 64 GiB of memory.
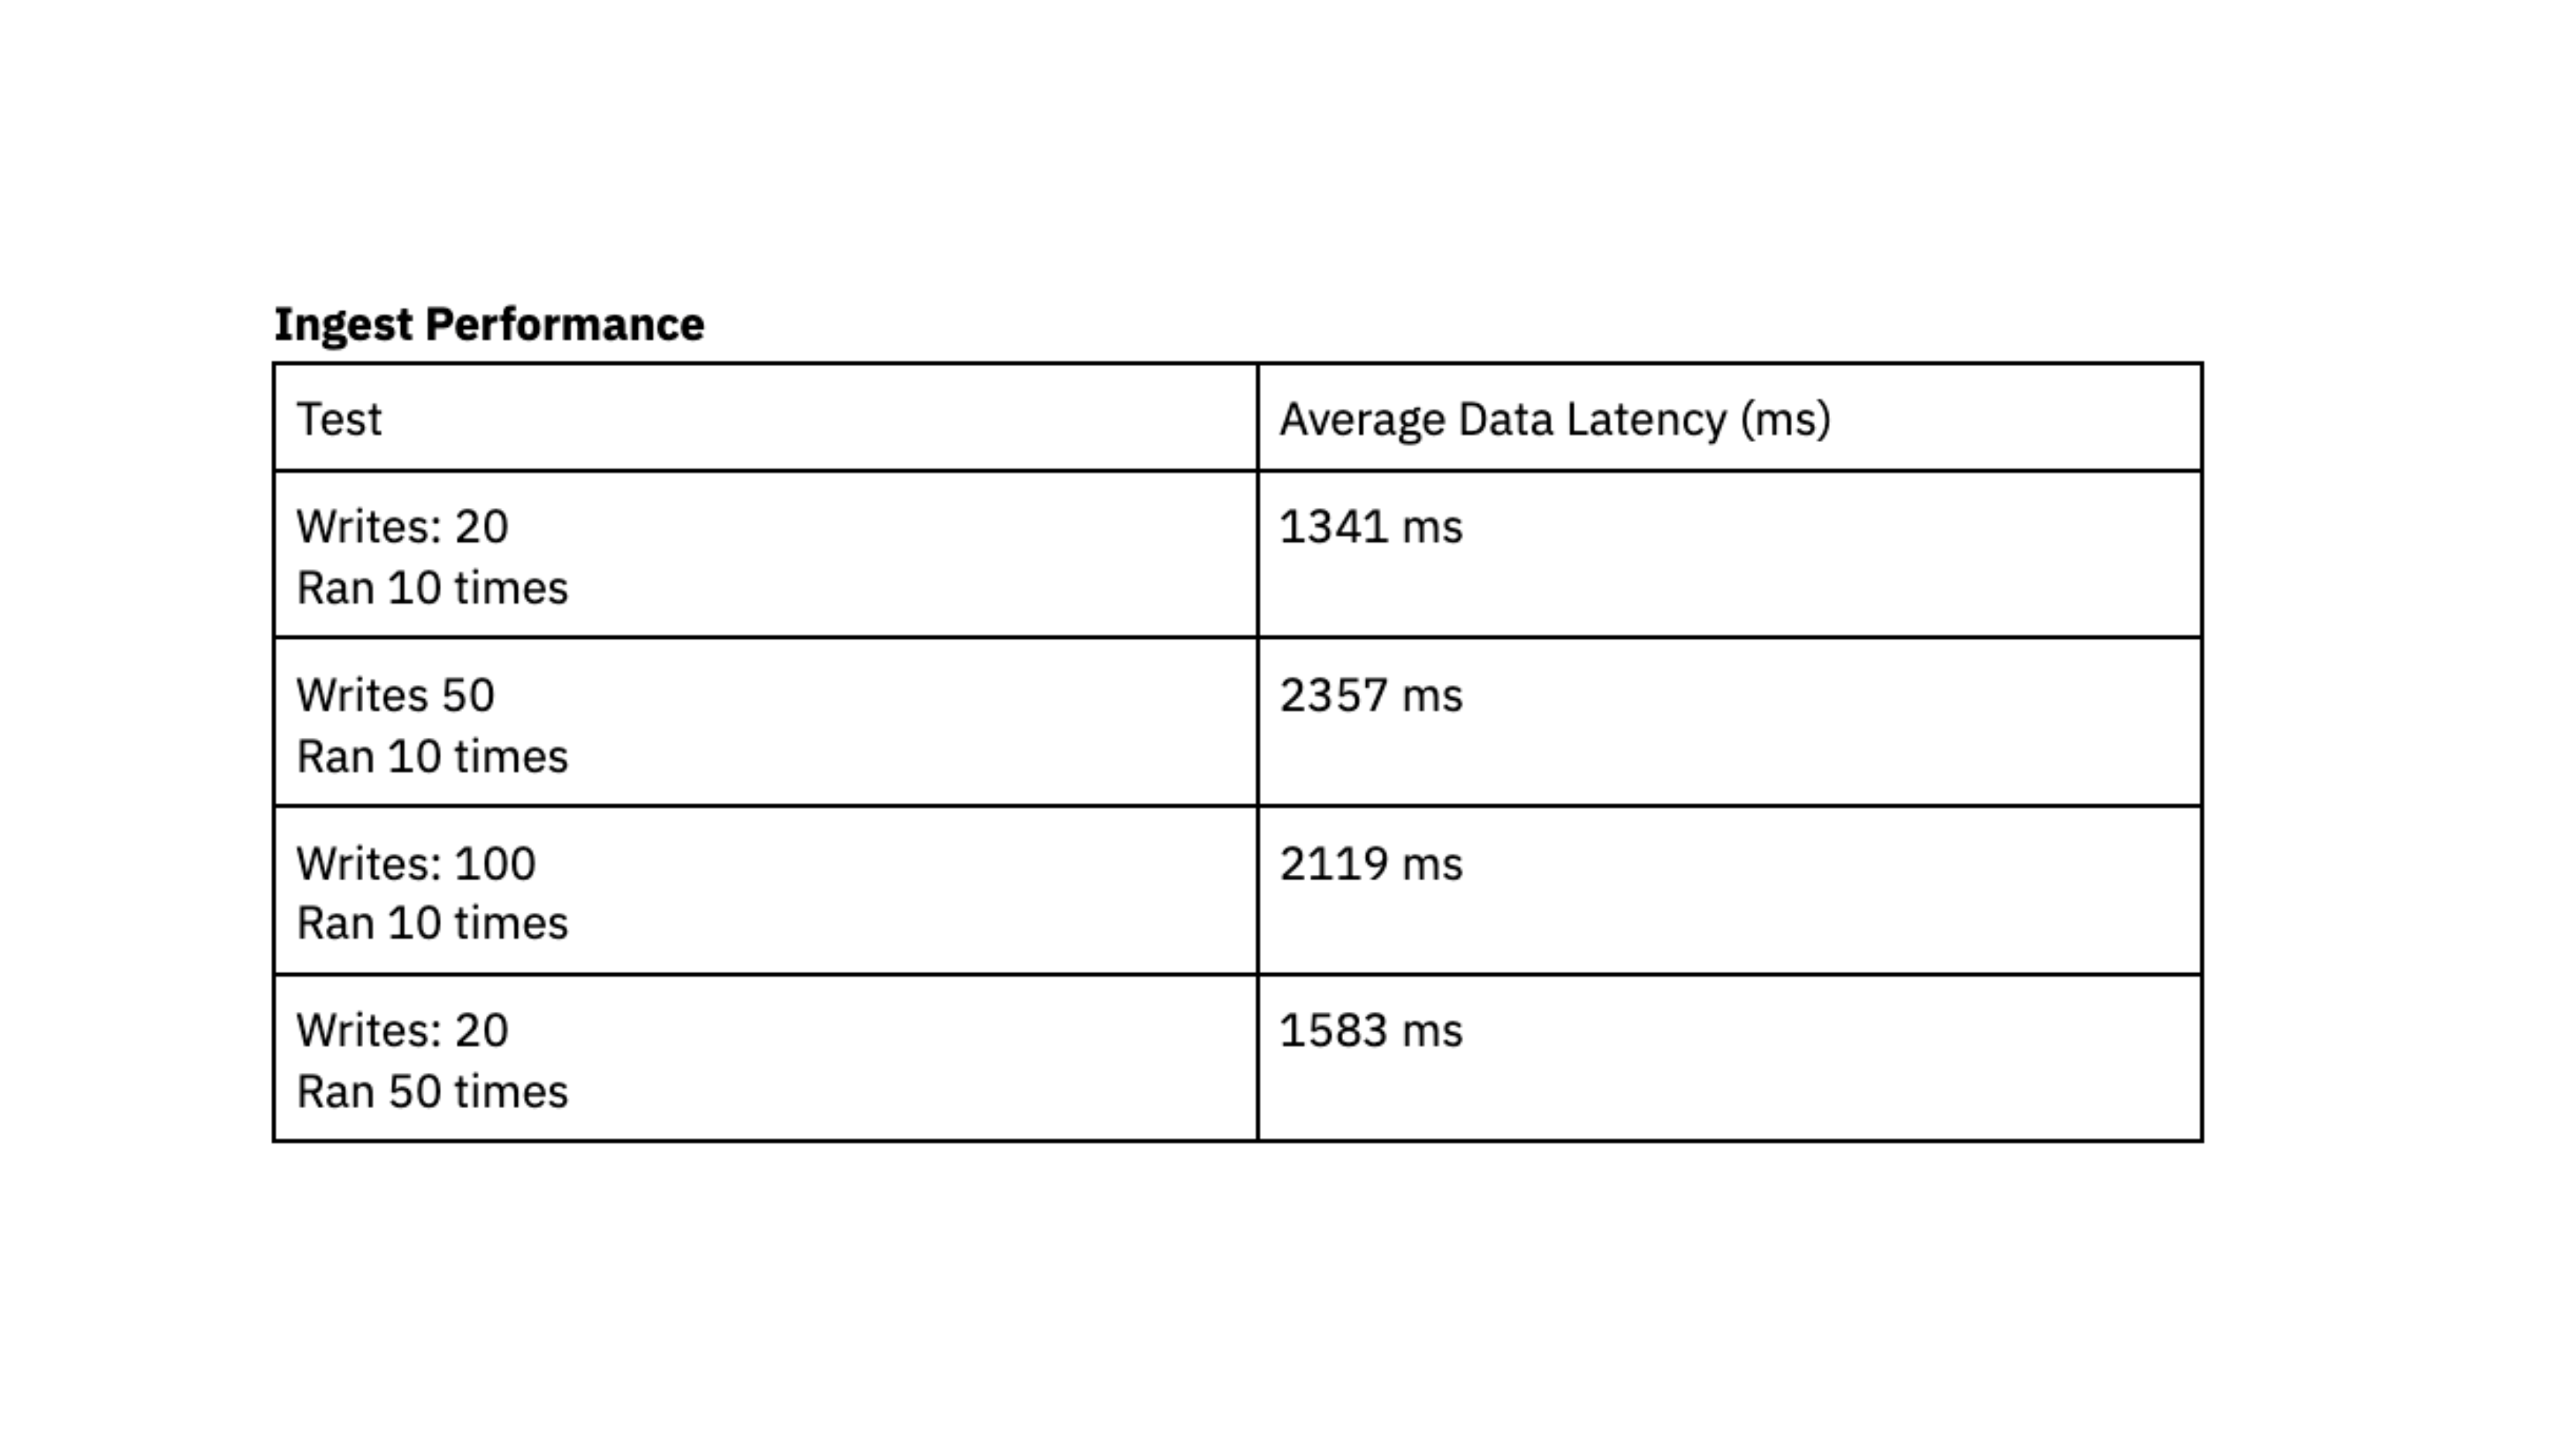
The performance tests indicate that Rockset is capable of achieving a data latency under 2.4 seconds, which represents the duration between the generation of data in DynamoDB and its availability for querying in Rockset. This load testing made us confident that we could consistently access data approximately 2 seconds after writing to DynamoDB, giving users up-to-date data in their dashboards. In the past, we struggled to achieve predictable latency with Elasticsearch and were excited by the consistency that we saw with Rockset during load testing.
Query Performance
For query performance, we executed X queries randomly every 10-60 milliseconds. We ran two tests using queries with different levels of complexity:
- Query 1: Simple query on a few fields of data. Dataset size of ~700K records and 2.5 GB.
- Query 2: Complex query that expands arrays into several rows using an unnest function. Data is filtered on the unnested fields. Two datasets were joined together: one dataset had 700K rows and 2.5 GB, the other dataset had 650K rows and 3GB.
We again ran the tests on a Rockset medium virtual instance with 8 vCPU of compute and 64 GiB of memory.
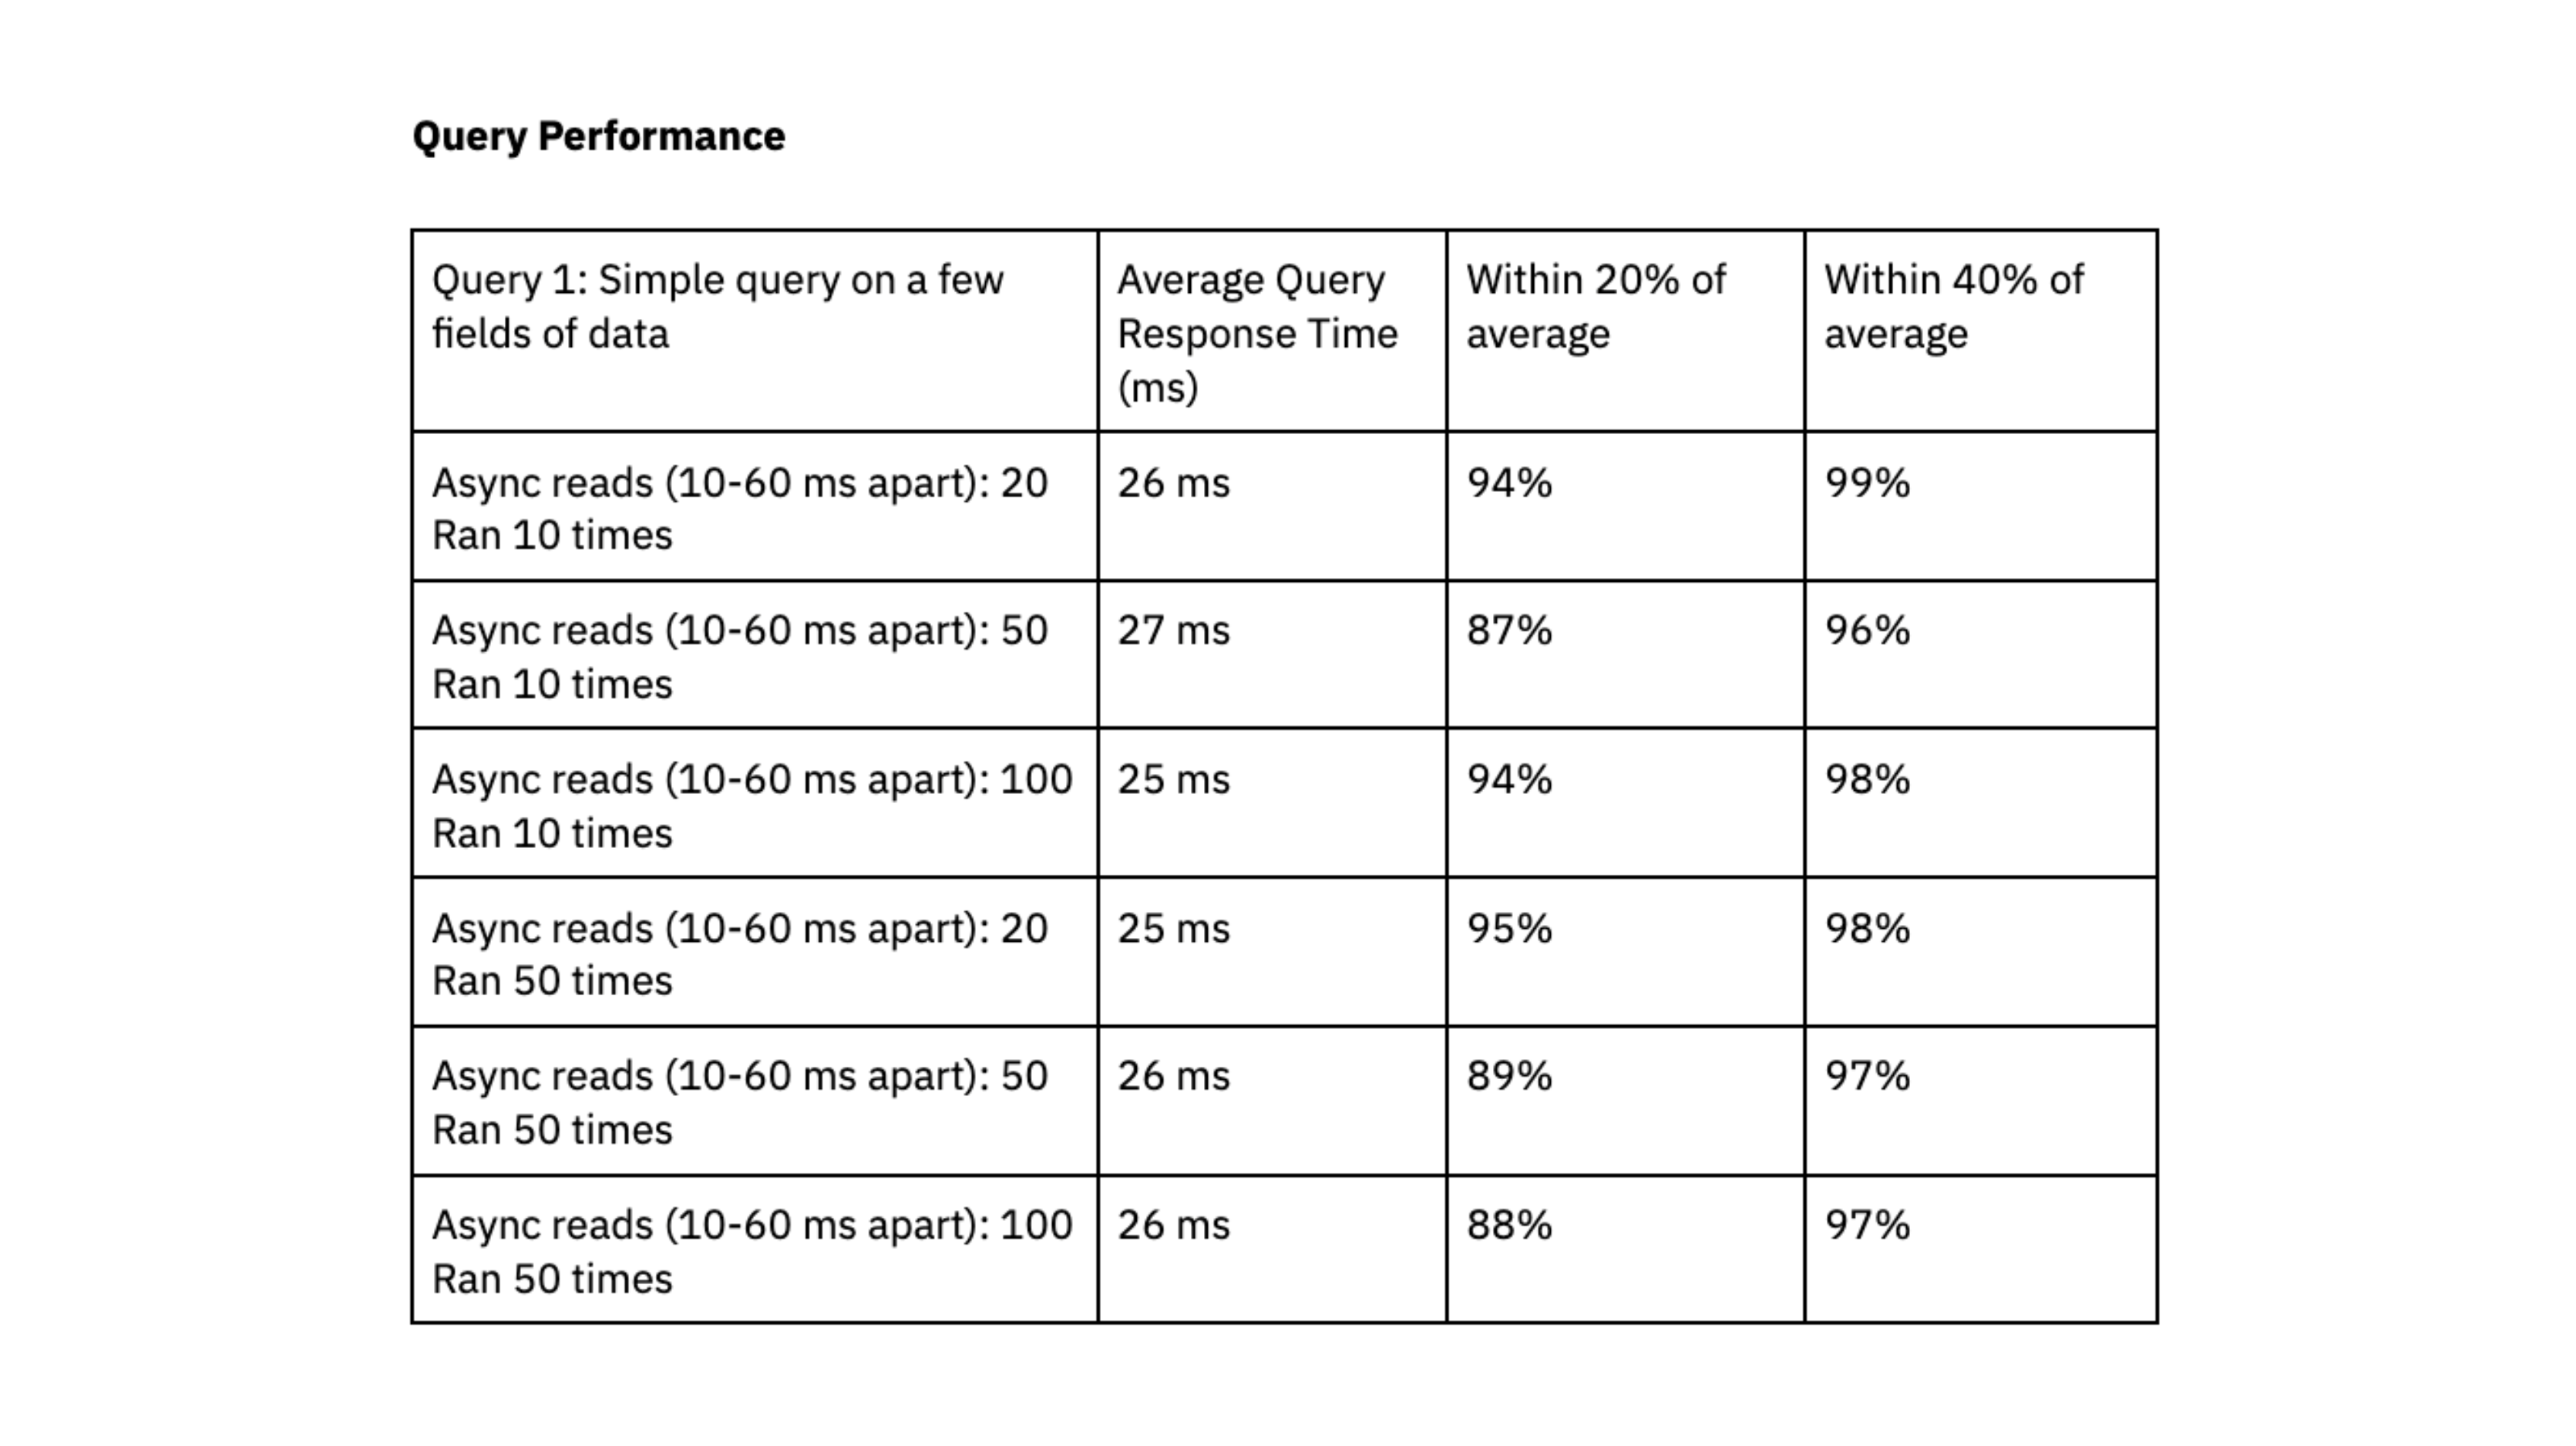
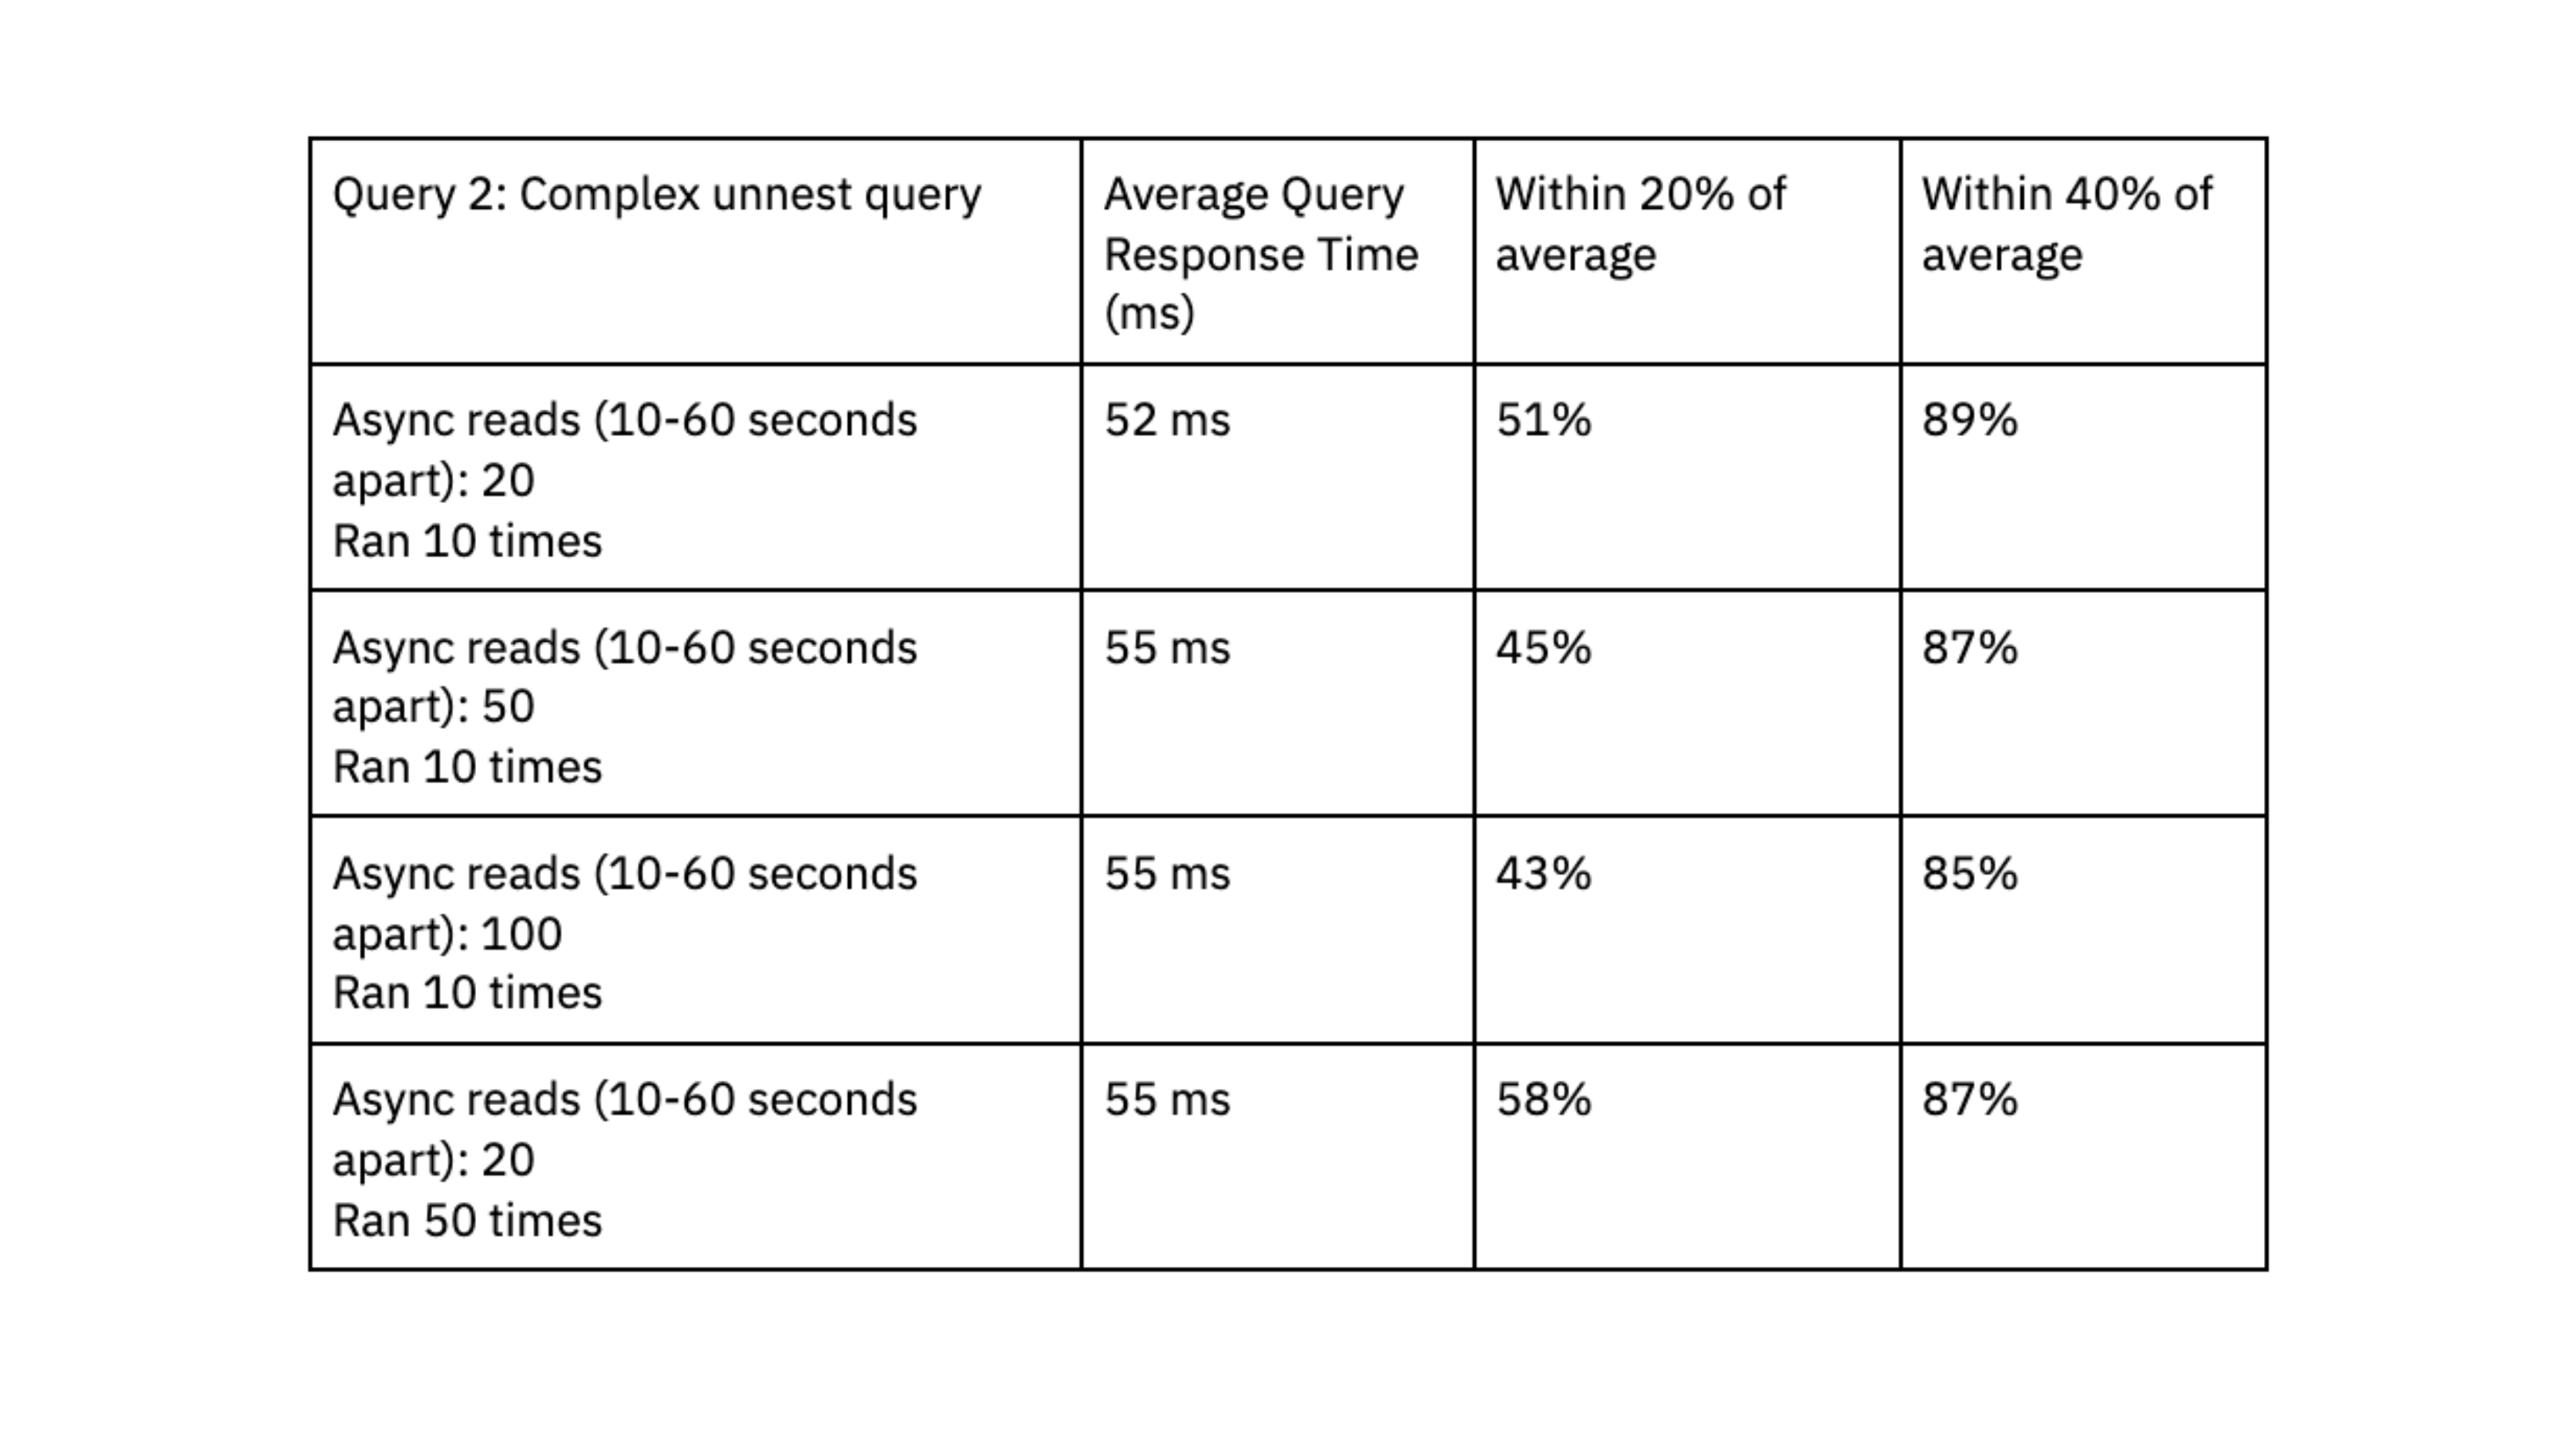
Rockset was able to deliver query response times in the range of double-digit milliseconds, even when handling workloads with high levels of concurrency.
To determine if Rockset can scale linearly, we evaluated query performance on a small virtual instance, which had 4vCPU of compute and 32 GiB of memory, against the medium virtual instance. The results showed that the medium virtual instance reduced query latency by a factor of 1.6x for the first query and 4.5x for the second query, suggesting that Rockset can scale efficiently for our workload.
We liked that Rockset achieved predictable query performance, clustered within 40% and 20% of the average, and that queries consistently delivered in double-digit milliseconds; this fast query response time is essential to our user experience.
Conclusion
We’re currently phasing real-time clinical trial monitoring into production as the new operational data hub for clinical teams. We have been blown away by the speed of Rockset and its ability to support complex filters, joins, and aggregations. Rockset achieves double-digit millisecond latency queries and can scale ingest to support real-time updates, inserts and deletes from DynamoDB.
Unlike OpenSearch, which required manual interventions to achieve optimal performance, Rockset has proven to require minimal operational effort on our part. Scaling up our operations to accommodate larger virtual instances and more clinical sponsors happens with just a simple push of a button.
Over the next year, we’re excited to roll out the real-time study participant monitoring to all customers and continue our leadership in the digital transformation of clinical trials.