- Contents
Whitepaper
9 Lessons Learned Scaling Elasticsearch for Real-Time Analytics
We’ve spoken with engineering leaders who start out using Elasticsearch for log analytics, a job that Elasticsearch is designed to do well. Elasticsearch is blazingly fast due to indexing, developer-friendly and has great documentation. And, when these same engineering teams realize they need real-time analytics for their application, they consider Elasticsearch because it’s already stood up in their stack. In this whitepaper, we capture 9 lessons learned from engineering leaders who have scaled Elasticsearch for real-time analytics. We cover situations in which Elasticsearch worked well for their use case, scaling challenges, common coping mechanisms and triggers for evaluating alternative solutions. We hope their advice and experience is helpful as you scale Elasticsearch.
Contents
Introduction
We’ve spoken with engineering leaders who start out using Elasticsearch for log analytics, a job that Elasticsearch is designed to do well. Elasticsearch is blazingly fast due to indexing, developer-friendly and has great documentation. And, when these same engineering teams realize they need real-time analytics for their application, they consider Elasticsearch because it’s already stood up in their stack.
In this whitepaper, we capture 9 lessons learned from engineering leaders who have scaled Elasticsearch for real-time analytics. We cover situations in which Elasticsearch worked well for their use case, scaling challenges, common coping mechanisms and triggers for evaluating alternative solutions. We hope their advice and experience is helpful as you scale Elasticsearch.
1. Streaming ingestion
Many companies start out streaming events from an event streaming platform like Apache Kafka into Elasticsearch for low-latency analytics.
When encountering frequently changing fields or high velocity data streams, Elastic, the company behind Elasticsearch, recommends moving to the Bulk API . The Bulk API saves on the cost of ingestion while also ensuring reliable application performance. When using the Bulk API, you’ll want to monitor the number of concurrent requests to the system so that indexing can keep up in Elasticsearch. Other best practices include controlling for the document size and refresh interval so that data ingestion can occur without encountering errors.
One customer data platform switched from streaming ingest to bulk ingest to ensure platform stability. They introduced BigTable as an intermediary step in their ingestion pipeline and snapshotted updates into Elasticsearch at specific time intervals. Similarly, a Fortune 500 marketing platform used Kafka to send updates from PostgreSQL to Elasticsearch for their reporting and insights product. In order to handle the ingest load, the engineering team used a scaled-out memory-optimized cluster and set a refresh interval of 15 minutes.
Many companies building their SaaS application want a seamless experience between transactions and analytics. If they are displaying a customer profile, they want it to include the most up-to-date information. If a user made a change in the platform, they want it to be displayed in their insights or reporting suite.
While this seamless user experience may be possible initially with Elasticsearch, when designing for scale you may need to alter your requirements around data latency to ensure reliable performance.
2. Inserts, updates and deletes
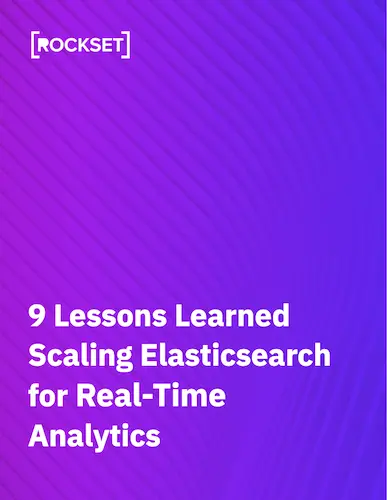
Change data capture streams (CDC streams) is when you stream the insert, update and delete operations from your transactional database to an analytical database like Elasticsearch. Popular transactional databases offer a streams API, DynamoDB provides DynamoDB Streams and MongoDB provides Change Streams . It’s also becoming increasingly common for engineering teams to use Debezium and Kafka for CDC streams from PostgreSQL, MySQL, and more. Typically, teams migrate to Elasticsearch when their transactional database becomes too slow or expensive due to the analytical load. Elasticsearch is built for log analytics but not for ingesting real-time updates and deletes at scale.
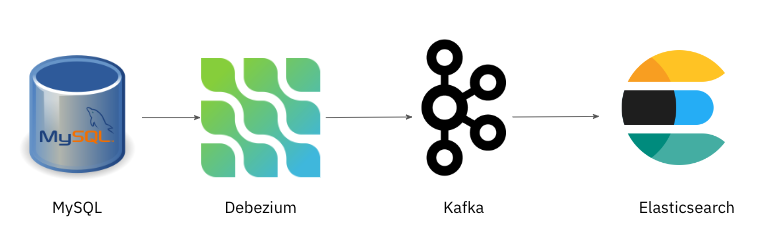
Image 1: Reference Debezium architecture for change data capture from MySQL to Elasticsearch.
When an update is made to a document in Elasticsearch, the old document is deleted and the new one is buffered and merged into a new segment. If your application has frequent inserts and updates, the merge operation can be a high cost as there are no in-place updates in Elasticsearch.
One customer data platform was using Elasticsearch to maintain an up-to-date 360 degree profile of users and customers. To decrease the costs of updates to a profile, the company wrote data to Elasticsearch in 30-second windows. Even with that step, 70% of the CPU for Elasticsearch was spent in index merging. Index merging can cause an increase in CPU utilization because, in addition to the resources required to update the document, every update requires that the analyzers be re-run in Elasticsearch.
Another challenge that arises is the operational burden of maintaining consistency between Elasticsearch and the source of truth system. One healthcare startup that used Elasticsearch for text search had an engineer spending two days a week manually managing updates in Elasticsearch. Every time a change was made in MySQL, a high-priority queue was created to update Elasticsearch. Most of the time, updates would occur in milliseconds but sometimes the changes piled up to form a long queue. In these scenarios, the engineer might have to delete and recreate the document to clear the queue. Monitoring and troubleshooting to ensure consistency between MySQL and Elasticsearch took a significant amount of time.
Whatnot , an e-commerce startup, powered their recommendation engine on Elasticsearch and found managing inserts, updates and deletes to be cumbersome. Emmanuel Fuentes, the Head of Machine Learning and Data Platforms, said: “Just maintaining our existing queries was also a huge effort in Elasticsearch. Our data changes frequently, so we were constantly upserting new data into existing tables. That required a time-consuming update to the relevant Elasticsearch index every time. And after every Elasticsearch index was created or updated, we had to manually test and update every other component in our data pipeline to make sure we had not created bottlenecks, introduced data errors, etc,”
Handling data changes, especially frequent changes, in Elasticsearch can cost on compute resources and overhead. If this is common in your application and you cannot handle data latency from batching and queuing into Elasticsearch, then you may want to evaluate solutions that support in-place updates.
3. Modeling relationships
Elasticsearch is a NoSQL database and takes a flattened view of the world which is at odds with the predominantly relational world of databases that we operate in. Relational databases are the most common, well-known databases for analytics and transactions. Furthermore, many teams sync data to Elasticsearch from relational OLTP databases including MySQL and PostgreSQL for search and analytics. This requires engineering teams to switch their relational data model to a non-relational model.
Elastic, the company behind Elasticsearch, acknowledges that “performing full SQL-style joins in a distributed system like Elasticsearch is prohibitively expensive.” There are workarounds to getting joins in Elasticsearch: denormalization, application-side joins, nested objects, parent-child relationships.
From conversations with engineering leaders well-versed in Elasticsearch, they recommend parent-child relationships as being a good workaround to the lack of join support without incurring ingestion lags or frequent reindexing. At scale, you will hit memory limits with using parent-child but it can provide an intermediary solution for one-parent to one-child types of schemas. Keep in mind that each workaround, given that joins are not first-class citizens in Elasticsearch, will add complexity, including data duplication, managing data changes, manually tuning for performance and indexing compute and time.
A SaaS company helps IT teams automate user lifecycle management and access controls. They built their application on Elasticsearch but kept encountering join use cases where they wanted to represent relationships between users, technologies, permissions and more. Over time, this became increasingly hard to manage and limited their flexibility to enrich the analytics in their application.
When you start to limit the usage patterns to maintain performance or cost, it might be a signal that it's time to evaluate other solutions that offer good support for modeling relationships.
Here’s an overview of the join workarounds in Elasticsearch to help you evaluate options for your workload:
Application-side joins: Many Elasticsearch customers will get around the lack of join support By implementing application-side joins. The data is stored in separate indices and a join is performed on the application side at query time. This does require creating and hand-tuning queries in the application code. This can be time-intensive to keep your application performant, especially as your data or queries change over time.
Nested Objects: It’s common to store closely related entities within the same document in Elasticsearch. That way, you can easily find related information. The challenge is that to add, update or remove the nested object requires the entire document to be reindexed. That’s because the nested object is also stored in the same document, a Lucene block. This can have a non-negligible overhead when changes are frequent.
Parent-Child: Parent child relationships overcome the challenge of frequent updates and deletes in nested objects. That’s because the parent and child are separated into two documents. This works well until you want to introduce sorting and scoring which are common in real-time analytics.
Denormalization at Ingest Time: Denormalization results in the best query performance but requires additional engineering overhead, especially when the data is constantly changing. In a denormalized data structure, the data is stored in a flattened structure with duplicate data being held in each document. This requires engineering effort to map relational tables to a single object in Elasticsearch. When the data changes, all of the documents where the data was copied also need to be updated and reindexed, costing you on compute.
4. Pre-joins and post-joins
Another workaround to the lack of SQL-style joins in Elasticsearch is to use a data warehouse as an intermediary step in the data pipeline. As data warehouses have been designed for analytical workloads, they can often pre-join or post-join data more efficiently. The downside is that teams are managing a data model across multiple systems, making changes cumbersome.
A supplier discovery software exported their OLTP data into BigQuery before loading it into Elasticsearch. The company reported spending thousands of dollars a month on both BigQuery and Elasticsearch. Had joins been well-supported in Elasticsearch, the company would not have needed the expense of two systems.
On the flip side, we’ve also seen companies use solutions like Presto to post-join data from Elasticsearch. A Fortune 50 Enterprise, architected their intelligence suite for their SaaS application across multiple databases and platforms including Elasticsearch for its search index and Presto for joins on Elasticsearch data. While this multiple database architecture delivered the performance required for their application, it was challenging to be dynamic and support new features and functionality. It was also challenging to achieve low latency with data delays across systems.
Using a data warehouse or query engine to pre-join or post-join data may be a common workaround but it introduces cost and complexity. The tradeoff is that engineering teams manage additional systems, additional pipelines cause data delays and data and query changes elongate development time.
5. Sharding and resharding
Performance challenges in Elasticsearch at scale often originate with the number of shards in a cluster. A shard is a horizontal partition of data that contains the resources to execute queries. The number of shards is set when the cluster is created and is determined based on the access patterns and load.
When dealing with multi-tenant applications, making this determination can be tricky as there is often nonuniform data distribution and load. And, if you realize down the road that you need to increase the number of shards you’ll need to reshard, requiring a new index or reindex of the data, a resource-intensive operation that has the potential to disrupt production workloads. Reindexing is done live and involves maneuvering multiple configurations in Elasticsearch.
From conversations with engineering leaders on sharding and resharding Elasticsearch, there are several common scenarios to watch for at scale. Handling each of these scenarios requires deep expertise in nodes, shards and indexes and so many organizations have dedicated considerable engineering resources to Elasticsearch.
One customer data platform encountered hotspots caused by differently sized segments in shards. This sharding issue arose as inserts, updates and deletes to Elasticsearch increased.
In Elasticsearch, data is written to shards and then flushed to immutable segments. As segments grow in size, they are joined with other segments in a process called merging. When a user profile was updated in the customer data platform, the out-of-date version was stored in the segment for a period of time before a merge operation took place and the disk space was reclaimed. When reclaimed disk space becomes available, Elasticsearch assumes all documents are uniformly sized and makes merge decisions based on the number of documents deleted. When dealing with heterogeneous document sizes, as is often the case in multi-tenant applications, some segments will grow faster in size than others, slowing down performance for the largest customers on the platform. In these cases, the remedy is to create a new index or reindex a large amount of data.
Image 2: After merging, you can see that the Lucene segments are all different sizes. These uneven segments impact performance and stability
Another hotspot encountered by the customer data platform was related to balancing shards on data nodes.
Elasticsearch balances shards on data nodes based on disk heuristics rather than load. For example, you may have a cluster with two nodes, ten shards each and identical shard sizes. In this scenario, Elasticsearch would distribute ten shards to each node. This has the potential to create a hotspot based on the query load. Determining the cause of the hotspot requires manual intervention, understanding which node is hot and then specifying the number of shards per node.
6. Hardware provisioning
Elasticsearch has a tightly coupled architecture where the clusters contain the compute and storage for the workload. This shared-nothing architecture has been the de facto for many database systems as it’s traditionally been challenging to decouple resources while still achieving the performance required of real-time analytics.
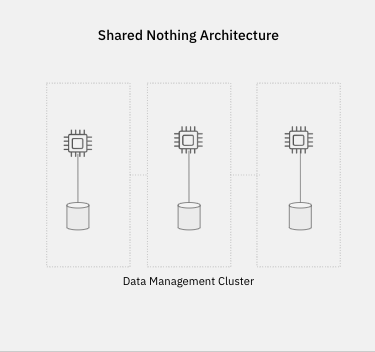
Image 3: In a shared nothing architecture data is partitioned across a set of nodes in a cluster. When two workloads need to access the same resource, they need to run on the nodes storing that data and hence compete for the same network, I/O and CPU resources.
With a tightly coupled architecture, there are several performance considerations to take into account including the sharing of resources for ingestion and queries, the use of replicas for workload isolation and the time it takes to scale up resources to handle additional load.
When operating at scale, there is the potential for writes to interfere with reads and vice versa because clusters are responsible for both ingestion and queries. To try and circumvent this scaling challenge, Elasticsearch introduced ingest nodes for workload isolation. While ingest nodes can initially be helpful, they do require adding replicas to the cluster. Replicas cause storage bloat, inconsistencies in analytics, additional writes and operational overhead. One trigger for evaluating other solutions that we heard from several engineering leaders is when you need to grow the cluster to accommodate additional storage from replicas.
In addition to hardware provisioning, there’s also scaling the cluster to accommodate additional load. Many users encounter challenges scaling up or down the system as rebalancing can be complicated; it also takes a lot of disk I/O to scale Elasticsearch. Teams will often overprovision if they anticipate greater load due to promotions or seasonality as it can take awhile for new servers to come online and then write the data to disk to rebalance the system.
Scaling down many distributed systems can be tricky and Elasticsearch is no exception. One engineering leader encountered errors trying to scale down the size of the cluster based on utilization and so ended up leaving the system overprovisioned for peak hours.
If you are overprovisioning and underutilizing resources in Elasticsearch, then it might be a good time to evaluate cloud-native solutions to scale efficiently.
7. Managing the system at scale
When getting started with Elasticsearch, many engineering leaders recommend using the managed service offerings from Elastic or AWS. This reduces the operational burden of managing a distributed system and allows engineering teams to get up and running relatively quickly. Furthermore, the expertise of the solutions engineering team provides best practices on data management, query DSL, data processing and cluster management.
While that is sufficient for many teams operating at a small scale, when teams start to scale the cluster they will want this expertise in-house to control costs. Seesaw , an edtech platform, was using Elasticsearch to calculate product usage statistics but overnight the pandemic caused remote teaching to accelerate and more students, teachers and parents adopted the platform. The engineering struggled to keep up with the 4-10x scale and to understand the product metrics coming out of Elasticsearch.
Elasticsearch is a highly complex distributed database that requires a massive amount of compute and memory for streaming, low-latency ingest and high-volume queries. Keeping reliable performance and curbing costs at scale requires experienced big data engineers.
While hiring big data engineers can enable Elasticsearch to be efficiently managed, it can come at the cost of distracting engineers from contributing to the core product experience. Engineering leaders recommend evaluating other solutions when they find that monitoring Grafana dashboards and maintaining clusters negatively impacts the product roadmap.
8. Changing the data or queries
Elasticsearch works well with well-established data models and balanced load in the system. Challenges arise when engineering teams want to iterate on their application, adding new datasets or changing the access patterns of the application. In some situations, this manifests for teams in the amount of time that it takes to modify data pipelines, write queries and run performance tests at scale. In other situations, adding new datasets can impact the refresh period for Elasticsearch and elongate the amount of time it takes for new data to be made available in an application.
For many applications looking to support self-service analytics, it can be challenging to identify all of the access patterns and define the indexes to achieve the performance requirements of the application. One logistics customer of Rockset, Command Alkon, had anticipated a 6-month roadmap to support ad-hoc queries in their application on Elasticsearch. They also estimated needing 2 engineers to maintain ongoing query performance.
Seesaw also encountered challenges adding new metrics when the COVID-19 pandemic unfolded and impacted their schools and students. Adding new product metrics in Elasticsearch required a significant amount of engineering effort and so often questions were left unanswered.
Emmanuel Fuentes at Whatnot found that adding a new signal to their recommendation engine was time-intensive in Elasticsearch. “Say we wanted to add a new user signal to our analytics pipeline. Using our previous serving infrastructure, the data would have to be sent through Confluent-hosted instances of Apache Kafka and ksqlDB and then denormalized and/or rolled up. Then, a specific Elasticsearch index would have to be manually adjusted or built for that data. Only then could we query the data. The entire process took weeks.”
9. Using the Elasticsearch DSL
Elasticsearch has its own Query DSL (Domain Specific Language) that is based on JSON and is the most efficient way to query the system. As the language is specific to Elasticsearch, the DSL can often limit adoption and usage by wider teams when looking to expand beyond log analytics use cases.
As a result, many organizations have several engineers that are dedicated to understanding the Query DSL and writing APIs to Elasticsearch for the wider team to use. This can limit the productivity of the engineering organization and create bottlenecks.
Sequoia Capital said their entire team was more productive when writing queries in SQL, as it's the common query language of analytics. Command Alkon, a construction logistics software company, was able to introduce new search and analytics use cases for their application faster when they switched from Elasticsearch to a system with full SQL. That’s because the wider engineering team knew SQL and could get started in minutes, lessening the adoption curve.
While Elasticsearch does have a SQL API, we found that many teams did not use it because of its lack of full SQL support, including joins. Furthermore, a native SQL database is different from an Elasticsearch cluster, users told us that trying to just apply SQL without taking into consideration the underlying NoSQL data model negatively impacts both performance and efficiency.
Key takeaways
Elasticsearch is designed for log analytics use cases at scale. Many teams start to encounter performance and cost challenges when they stretch Elasticsearch for serving business reporting or user-facing analytics. From our conversations with engineering leaders, we found that common scaling challenges include streaming ingestion, frequently mutating data and support for complex analytics, including joins. This manifested itself in limiting engineering’s ability to support new application features and added to operational overhead.
There are coping mechanisms for teams using Elasticsearch for real-time analytics and we covered a few of the common ones such as sacrificing data freshness, using managed services and making use of join workarounds such as denormalization and parent-child relationships.
While these coping mechanisms are used by teams at scale, many engineering leaders cross a threshold and start to look for alternative solutions to Elasticsearch. Common triggers include the number of datasets that need to be joined increasing, the refresh period for Elasticsearch exceeding the SLA or the cluster growing to accommodate more storage. If you fit this description, Rockset is an alternative to Elasticsearch for real-time analytics and our solutions engineering team would welcome discussing your use case and requirements as well as providing migration support.