Analytics on Kafka Event Streams Using Druid, Elasticsearch and Rockset
November 6, 2019
Events are messages that are sent by a system to notify operators or other systems about a change in its domain. With event-driven architectures powered by systems like Apache Kafka becoming more prominent, there are now many applications in the modern software stack that make use of events and messages to operate effectively. In this blog, we will examine the use of three different data backends for event data - Apache Druid, Elasticsearch and Rockset.
Using Event Data
Events are commonly used by systems in the following ways:
- For reacting to changes in other systems: e.g. when a payment is completed, send the user a receipt.
- Recording changes that can then be used to recompute state as needed: e.g. a transaction log.
- Supporting separation of data access (read/write) mechanisms like CQRS.
- Help understanding and analyze the current and past state of a system.
We will focus on the use of events to help understand, analyze and diagnose bottlenecks in applications and business processes, using Druid, Elasticsearch and Rockset in conjunction with a streaming platform like Kafka.
Types of Event Data
Applications emit events that correspond to important actions or state changes in their context. Some examples of such events are:
- For an airline price aggregator, events generated when a user books a flight, when the reservation is confirmed with the airline, when user cancels their reservation, when a refund is completed, etc.
// an example event generated when a reservation is confirmed with an airline.
{
  "type": "ReservationConfirmed",
  "reservationId": "RJ4M4P",
  "passengerSequenceNumber": "ABC123",
  "underName": {
    "name": "John Doe"
  },
  "reservationFor": {
    "flightNumber": "UA999",
    "provider": {
      "name": "Continental",
      "iataCode": "CO",
    },
    "seller": {
      "name": "United",
      "iataCode": "UA"
    },
    "departureAirport": {
      "name": "San Francisco Airport",
      "iataCode": "SFO"
    },
    "departureTime": "2019-10-04T20:15:00-08:00",
    "arrivalAirport": {
      "name": "John F. Kennedy International Airport",
      "iataCode": "JFK"
    },
    "arrivalTime": "2019-10-05T06:30:00-05:00"
  }
}
- For an e-commerce website, events generated as the shipment goes through each stage from being dispatched from the distribution center to being received by the buyer.
// example event when a shipment is dispatched.
{
  "type": "ParcelDelivery",
  "deliveryAddress": {
    "type": "PostalAddress",
    "name": "Pickup Corner",
    "streetAddress": "24 Ferry Bldg",
    "addressLocality": "San Francisco",
    "addressRegion": "CA",
    "addressCountry": "US",
    "postalCode": "94107"
  },
  "expectedArrivalUntil": "2019-10-12T12:00:00-08:00",
  "carrier": {
    "type": "Organization",
    "name": "FedEx"
  },
  "itemShipped": {
    "type": "Product",
    "name": "Google Chromecast"
  },
  "partOfOrder": {
    "type": "Order",
    "orderNumber": "432525",
    "merchant": {
      "type": "Organization",
      "name": "Bob Dole"
    }
  }
}
- For an IoT platform, events generated when a device registers, comes online, reports healthy, requires repair/replacement, etc.
// an example event generated from an IoT edge device.
{
    "deviceId": "529d0ea0-e702-11e9-81b4-2a2ae2dbcce4",
    "timestamp": "2019-10-04T23:56:59+0000",
    "status": "online",
    "acceleration": {
        "accelX": "0.522",
        "accelY": "-.005",
        "accelZ": "0.4322"
    },
    "temp": 77.454,
    "potentiometer": 0.0144
}
These types of events can provide visibility into a specific system or business process. They can help answer questions with regard to a specific entity (user, shipment, or device), as well as support analysis and diagnosis of potential issues quickly, in aggregate, over a specific time range.
Building Event Analytics
In the past, events like these would stream into a data lake and get ingested into a data warehouse and be handed off to a BI/data science engineer to mine the data for patterns.
Before

After
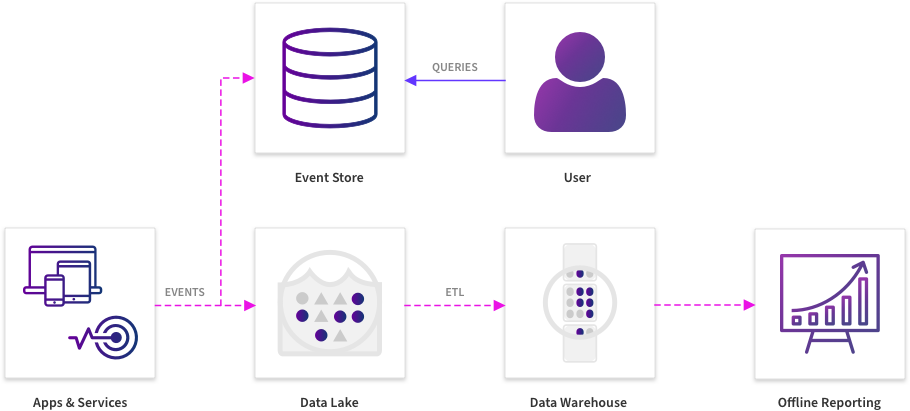
This has changed with a new generation of data infrastructure because responding to changes in these events quickly and in a timely manner is becoming critical to success. In a situation where every second of unavailability can rack up revenue losses, understanding patterns and mitigating issues that are adversely affecting system or process health have become time-critical exercises.
When there is a need for analysis and diagnosis to be as real-time as possible, the requirements of a system that helps perform event analytics must be rethought. There are tools that specialize in performing event analytics in specific domains - such as product analytics and clickstream analytics, but given the specific needs of a business, we often want to build custom tooling that is specific to the business or process, allowing its users to quickly understand and take action as required based on these events. In a lot of these case, systems like these are built in-house by combining different pieces of technology including streaming pipelines, lakes and warehouses. When it comes to serving queries, this needs an analytics backend that has the following properties:
- Fast Ingestion — Even with hundreds of thousands of events flowing every second, a backend to facilitate event data analytics must be able to keep up with that rate. Complex offline ETL processes are not preferable as they would add minutes to hours before the data is available to query.
- Interactive Latencies — The system must allow ad-hoc queries and drilldowns in real-time. Sometimes understanding a pattern in the events requires being able to group by different attributes in the events to try and understand the correlations in real-time.
- Complex Queries — The system must allow querying using an expressive query language to allow expressing value lookups, filtering on a predicate, aggregate functions, and joins.
- Developer-Friendly - The system must come with libraries and SDKs that allow developers to write custom applications on top of it, as well as support dashboarding.
- Configurable and Scalable - This includes being able to control the time for which records are retained, number of replicas of data being queried, and being able to scale up to support more data with minimal operational overhead.
Druid
Apache Druid is a column-oriented distributed data store for serving fast queries over data. Druid supports streaming data sources, Apache Kafka and Amazon Kinesis, through an indexing service that takes data coming in through these streams and ingests them, and batch ingestion from Hadoop and data lakes for historical events. Tools like Apache Superset are commonly used to analyze and visualize the data in Druid. It is possible to configure aggregations in Druid that can be performed at ingestion time to turn a range of records into a single record that can then be written.
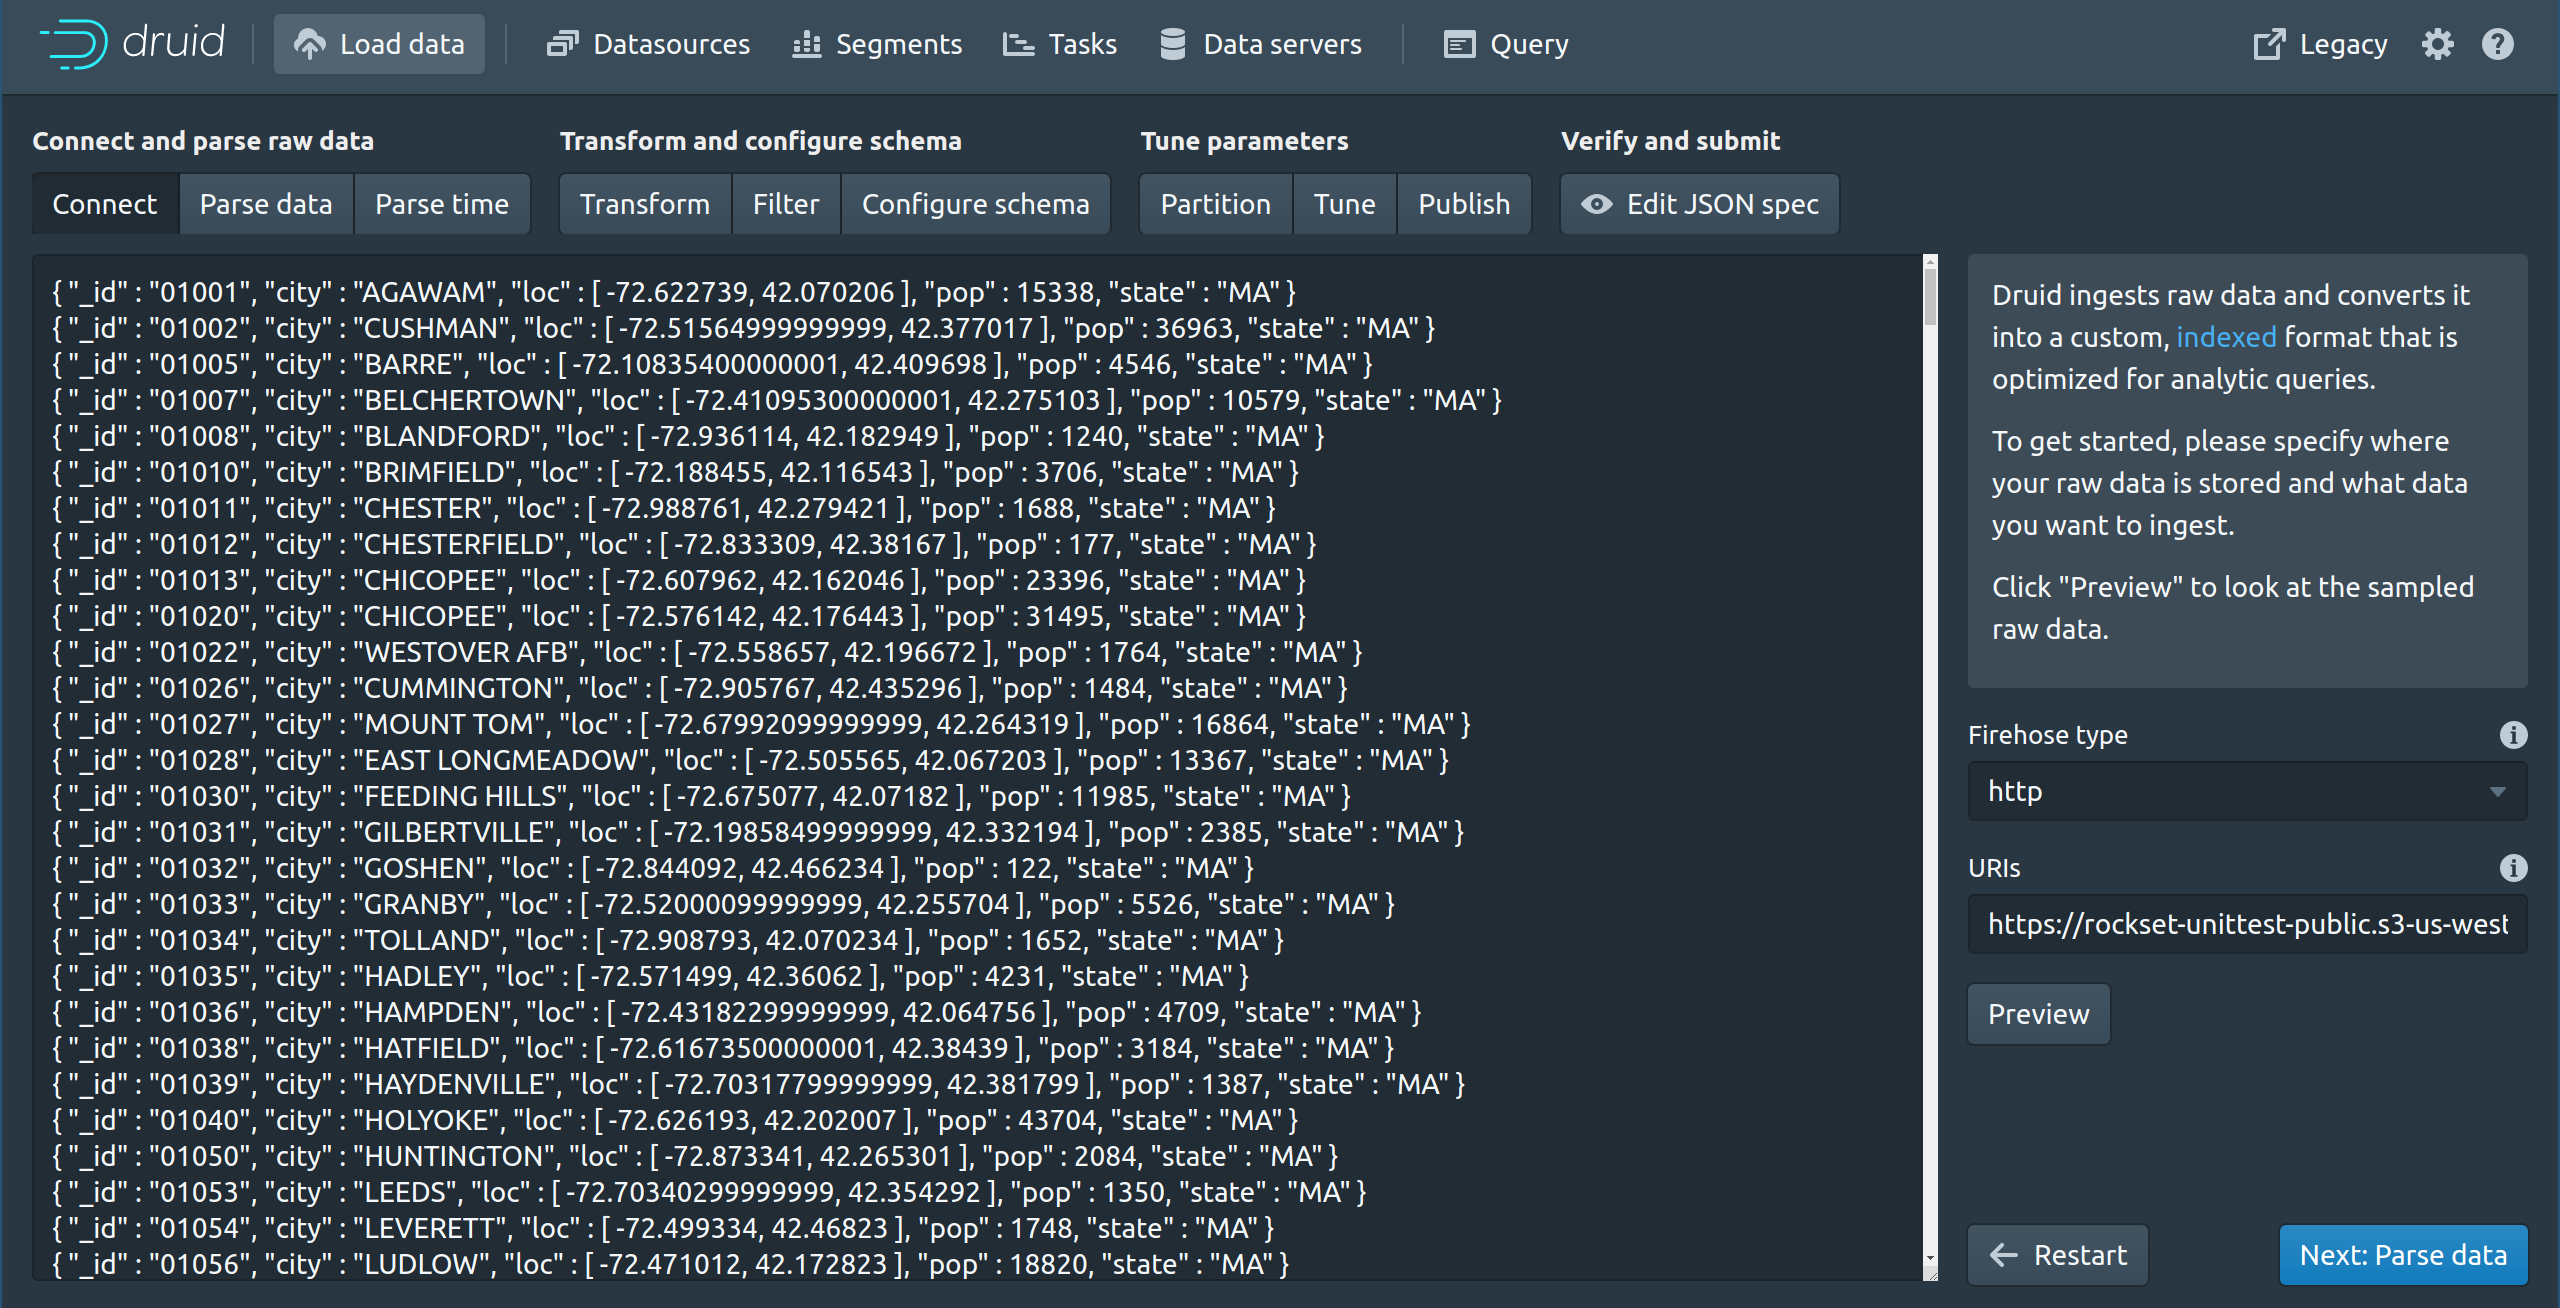
In this example, we are inserting a set of JSON events into Druid. Druid does not natively support nested data, so, we need to flatten arrays in our JSON events by providing a flattenspec, or by doing some preprocessing before the event lands in it.
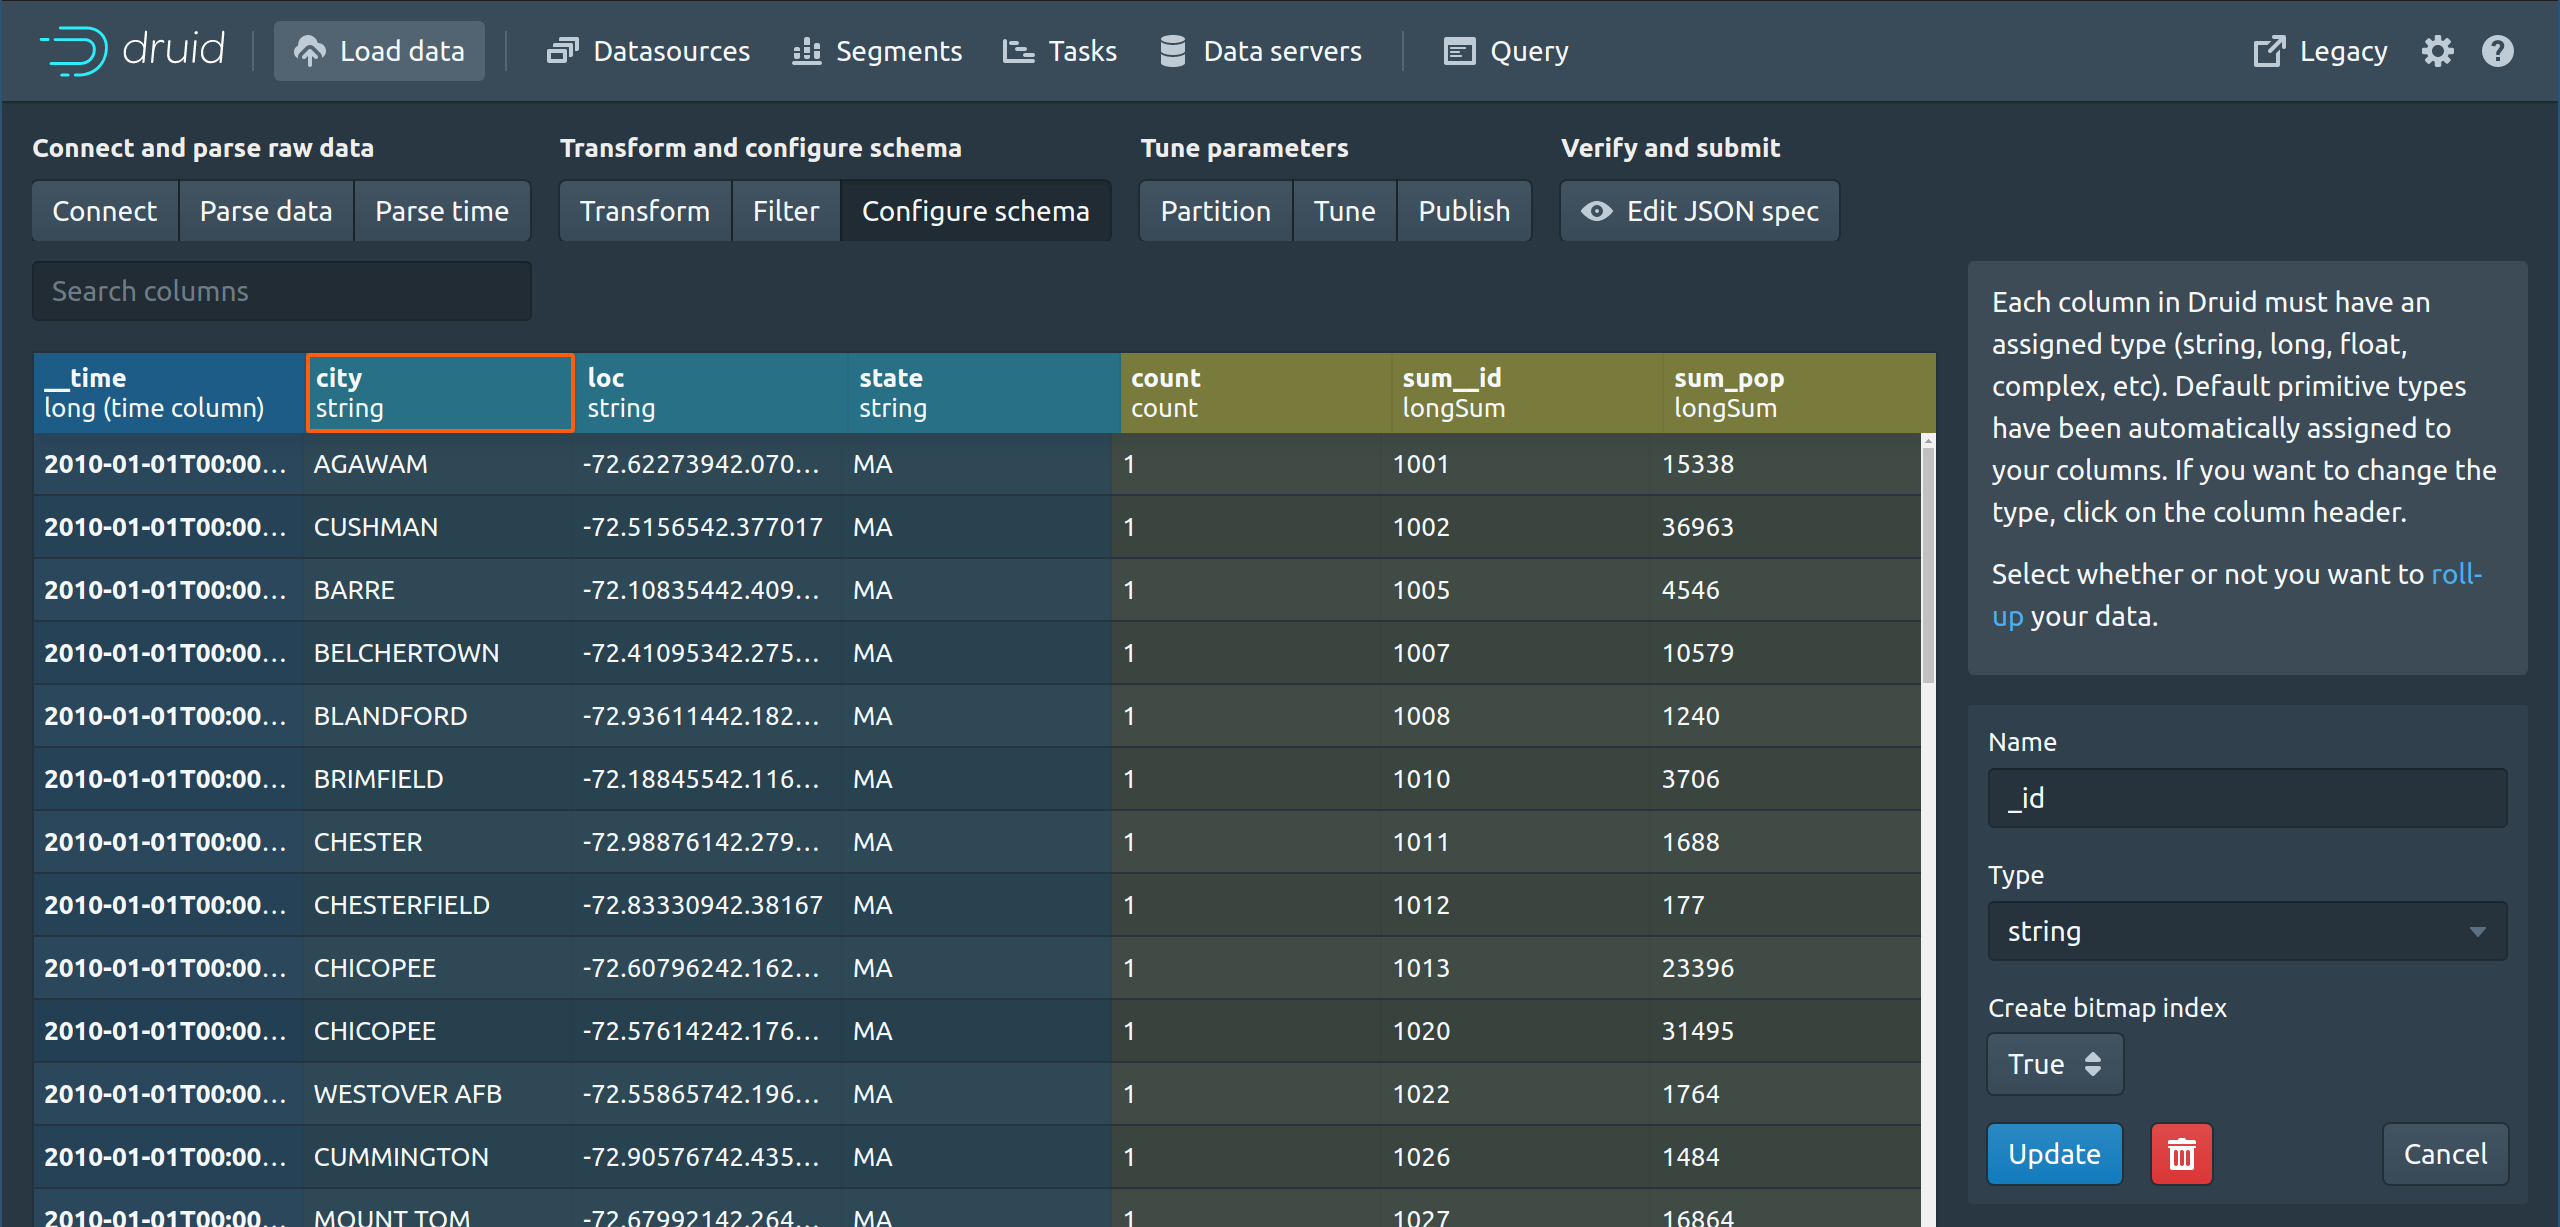
Druid assigns types to columns — string, long, float, complex, etc. The type enforcement at the column level can be restrictive if the incoming data presents with mixed types for a particular field/fields. Each column except the timestamp can be of type dimension or metric. One can filter and group by on dimension columns, but not on metric columns. This needs some forethought when picking which columns to pre-aggregate and which ones will be used for slice-and-dice analyses.
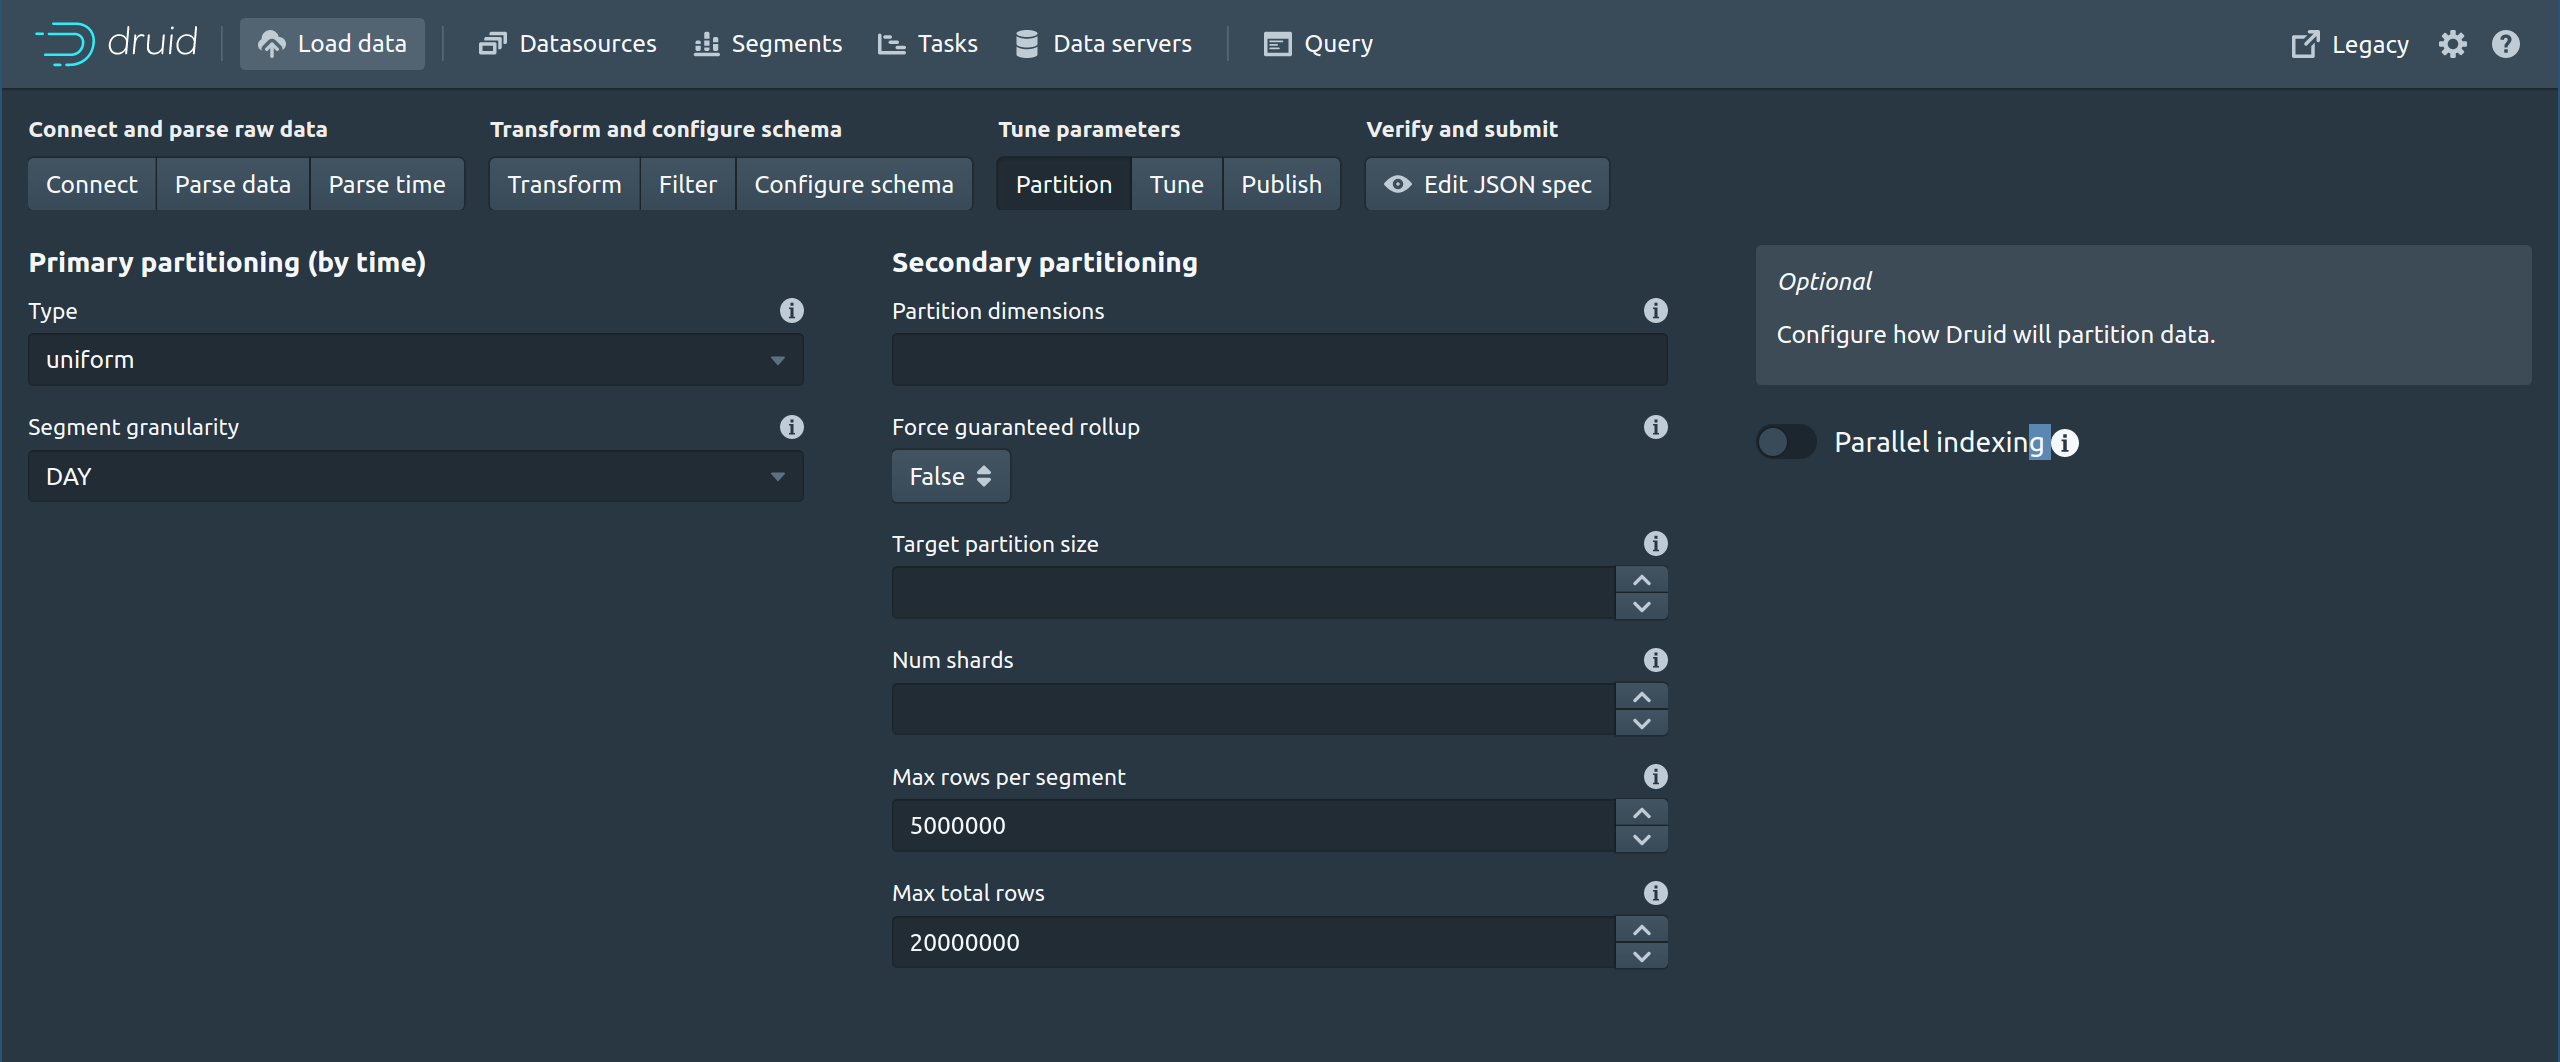
Partition keys must be picked carefully for load-balancing and scaling up. Streaming new updates to the table after creation requires using one of the supported ways of ingesting - Kafka, Kinesis or Tranquility.
Druid works well for event analytics in environments where the data is somewhat predictable and rollups and pre-aggregations can be defined a priori. It involves some maintenance and tuning overhead in terms of engineering, but for event analytics that doesn’t involve complex joins, it can serve queries with low latency and scale up as required.
Summary:
- Low latency analytical queries over the column store
- Ingest time aggregations can help reduce volume of data written
- Good support for SDKs and libraries in different programming languages
- Works well with Hadoop
- Type enforcement at the column level can be restrictive with mixed types
- Medium to high operational overhead at scale
- Estimating resources and capacity planning is difficult at scale
- Lacks support for nested data natively
- Lacks support for SQL JOINs
Elasticsearch
Elasticsearch is a search and analytics engine that can also be used for queries over event data. Most popular for queries over system and machine logs for its full-text search capabilities, Elasticsearch can be used for ad hoc analytics in some specific cases. Built on top of Apache Lucene, Elasticsearch is often used in conjunction with Logstash for ingesting data, and Kibana as a dashboard for reporting on it. When used together with Kafka, the Kafka Connect Elasticsearch sink connector is used to move data from Kafka to Elasticsearch.
Elasticsearch indexes the ingested data, and these indexes are typically replicated and are used to serve queries. The Elasticsearch query DSL is mostly used for development purposes, although there is SQL support in X-Pack that supports some types of SQL analytical queries against indices in Elasticsearch. This is necessary because for event analytics, we want to query in a versatile manner.
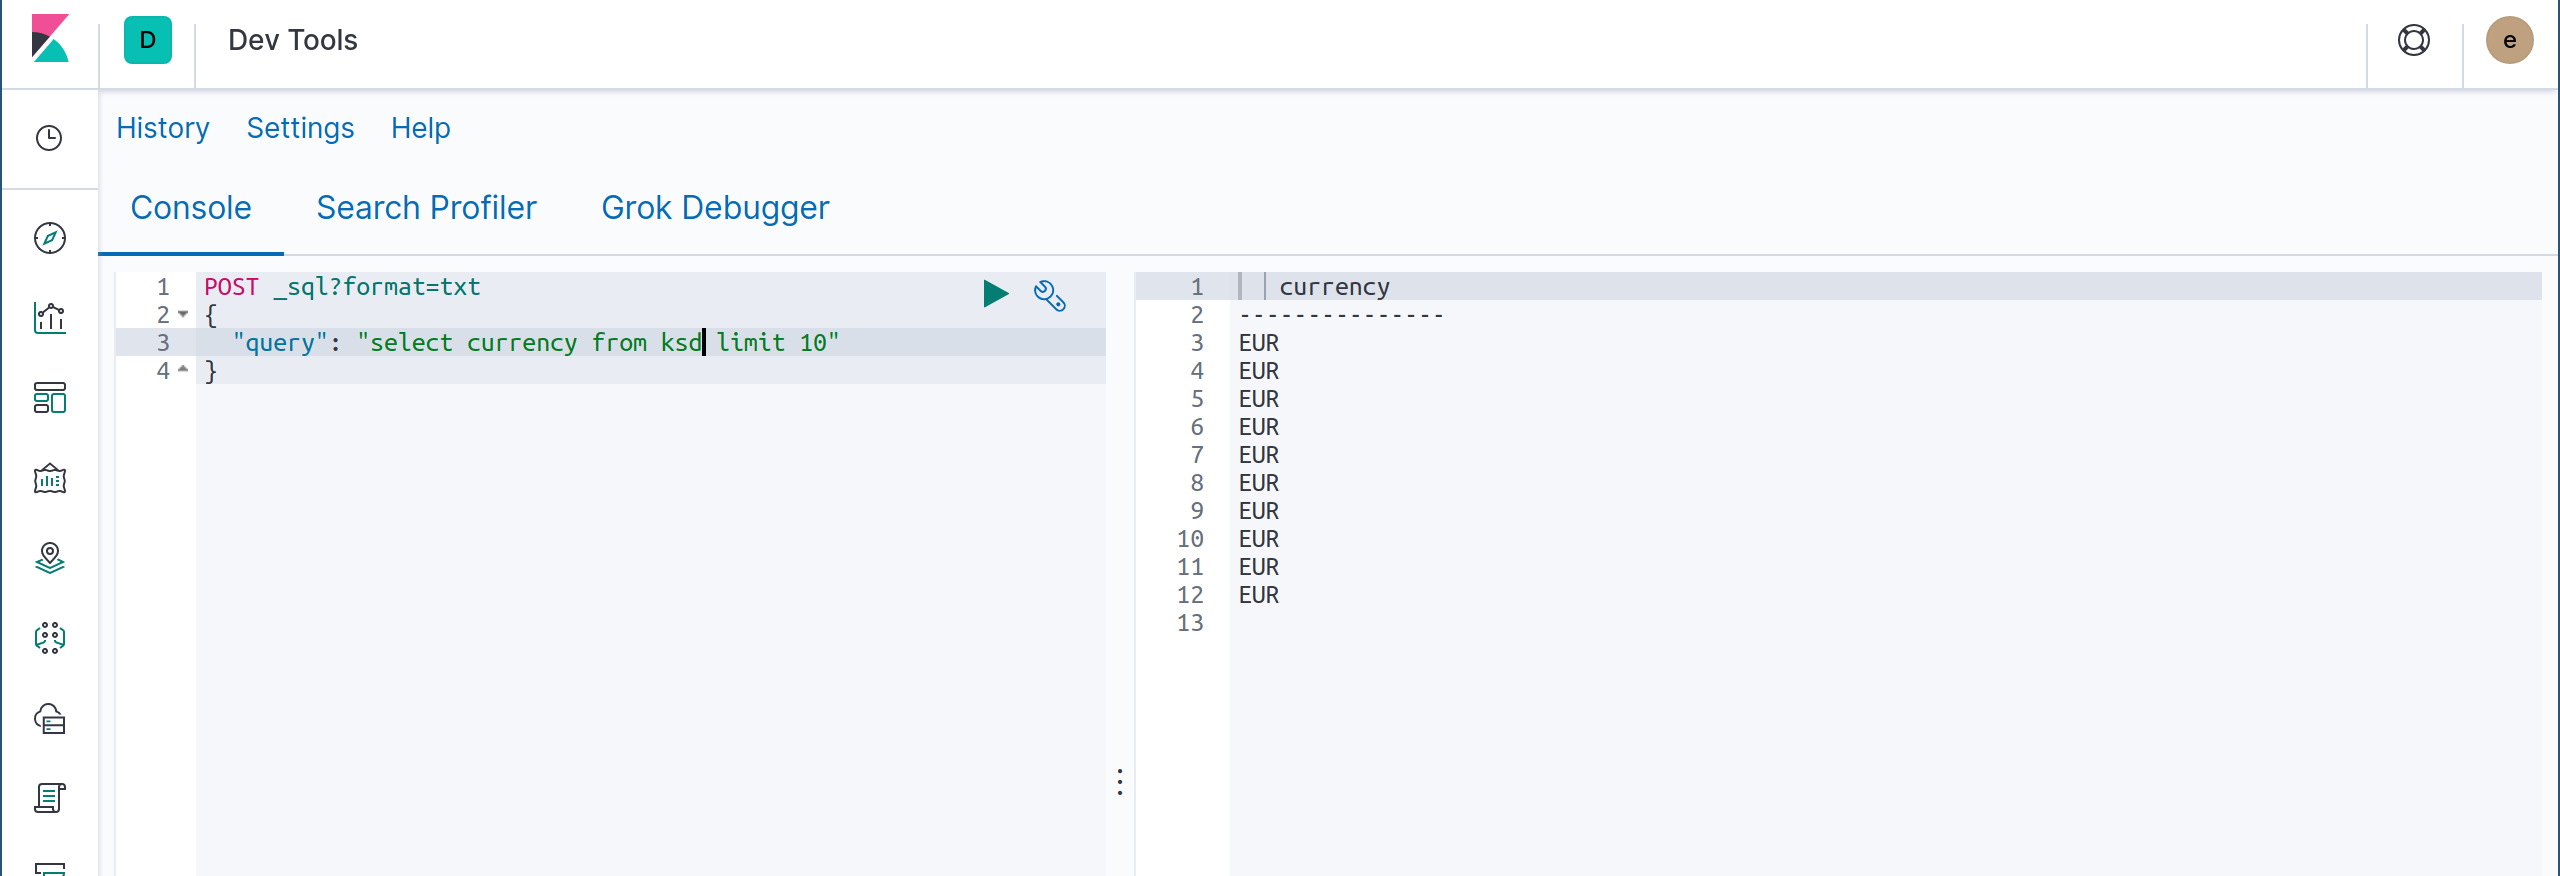
Elasticsearch SQL works well for basic SQL queries but cannot currently be used to query nested fields, or run queries that involve more complex analytics like relational JOINs. This is partly due to the underlying data model.
It is possible to use Elasticsearch for some basic event analytics and Kibana is an excellent visual exploration tool with it. However, the limited support for SQL implies that the data may need to be preprocessed before it can be queried effectively. Also, there’s non-trivial overhead in running and maintaining the ingestion pipeline and Elasticsearch itself as it scales up. Therefore, while it suffices for basic analytics and reporting, its data model and restricted query capabilities make it fall short of being a fully featured analytics engine for event data.
Summary:
- Excellent support for full-text search
- Highly performant for point lookups because of inverted index
- Rich SDKs and library support
- Lacks support for JOINs
- SQL support for analytical queries is nascent and not fully featured
- High operational overhead at scale
- Estimating resources and capacity planning is difficult
Rockset
Rockset is a backend for event stream analytics that can be used to build custom tools that facilitate visualizing, understanding, and drilling down. Built on top of RocksDB, it is optimized for running search and analytical queries over tens to hundreds of terabytes of event data.
Ingesting events into Rockset can be done via integrations that require nothing more than read permissions when they’re in the cloud, or directly by writing into Rockset using the JSON Write API.
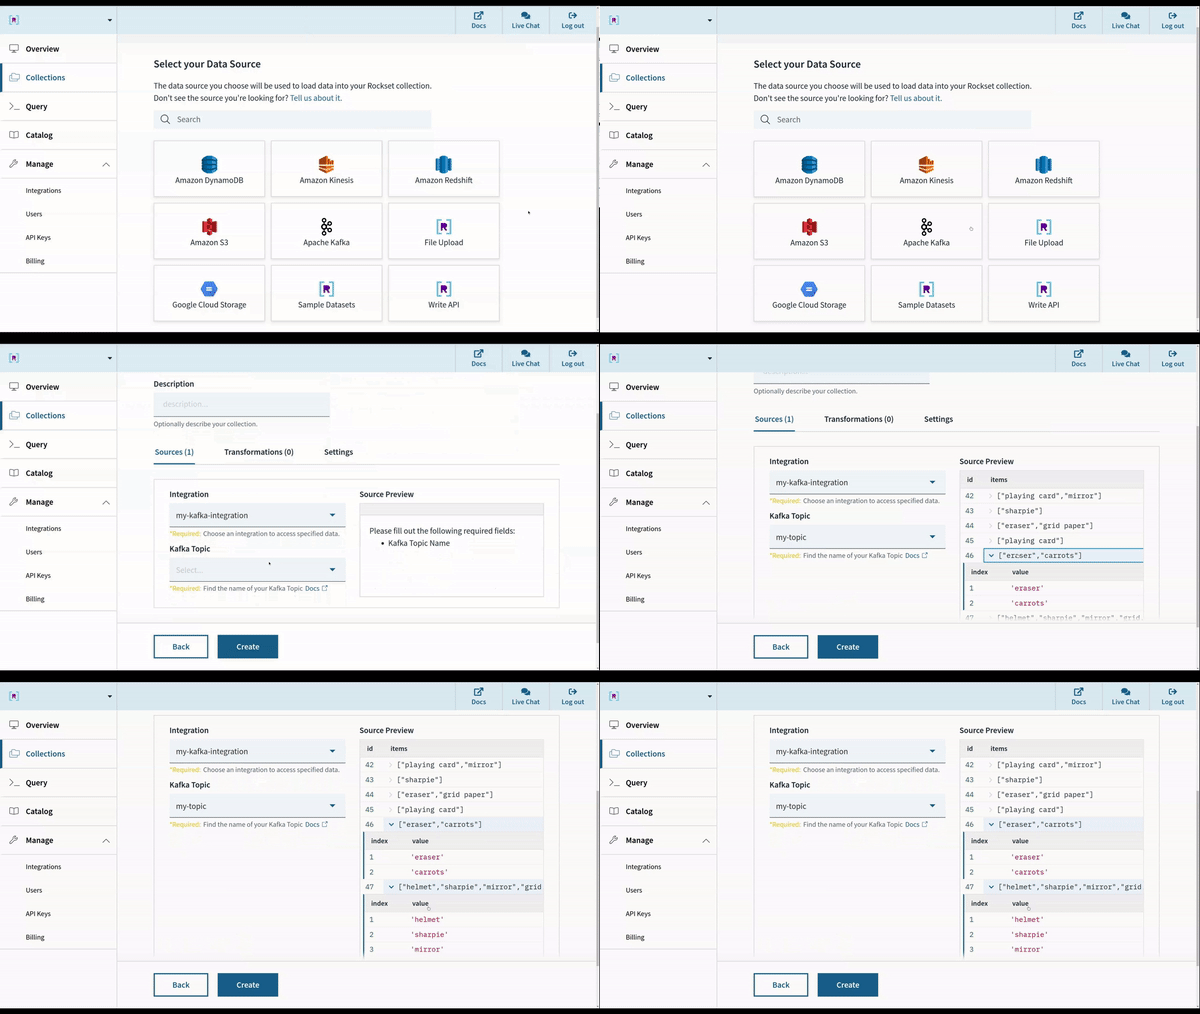
These events are processed within seconds, indexed and made available for querying. It is possible to pre-process data using field mappings and SQL-function-based transformations during ingestion time. However, no preprocessing is required for any complex event structure — with native support for nested fields and mixed-type columns.
Rockset supports using SQL with the ability to execute complex JOINs. There are APIs and language libraries that let custom code connect to Rockset and use SQL to build an application that can do custom drilldowns and other custom features. Using Rockset's Converged Index™, ad-hoc queries run to completion very fast.
Making use of the ALT architecture, the system automatically scales up different tiers—ingest, storage and compute—as the size of the data or the query load grows when building a custom dashboard or application feature, thereby removing most of the need for capacity planning and operational overhead. It does not require partition or shard management, or tuning because optimizations and scaling are automatically handled under the hood.
For fast ad-hoc analytics over real-time event data, Rockset can help by serving queries using full SQL, and connectors to tools like Tableau, Redash, Superset and Grafana, as well as programmatic access via REST APIs and SDKs in different languages.
Summary:
- Optimized for point lookups as well as complex analytical queries
- Support for full SQL including distributed JOINs
- Built-in connectors to streams and data lakes
- No capacity estimation needed - scales automatically
- Supports SDKs and libraries in different programming languages
- Low operational overhead
- Free forever for small datasets
- Offered as a managed service
Visit our Kafka solutions page for more information on building real-time dashboards and APIs on Kafka event streams.
References:

